This Gold Chart Looks Very Bearish
Last night we opened a sell forex signal in Gold. That signal was mostly based on the H1 Gold chart; the stochastic indicator was almost ov
Last night we opened a sell forex signal in Gold. That signal was mostly based on the H1 Gold chart; the stochastic indicator was almost overbought and the 100 SMA was providing some sort of resistance on top.
During the night, Gold climbed for another $4-$5 to above $1,282 which made the bearish chart setup on the H1 timeframe invalid. But, the H4 chart has turned bearish now so our Gold signal still looks pretty good.
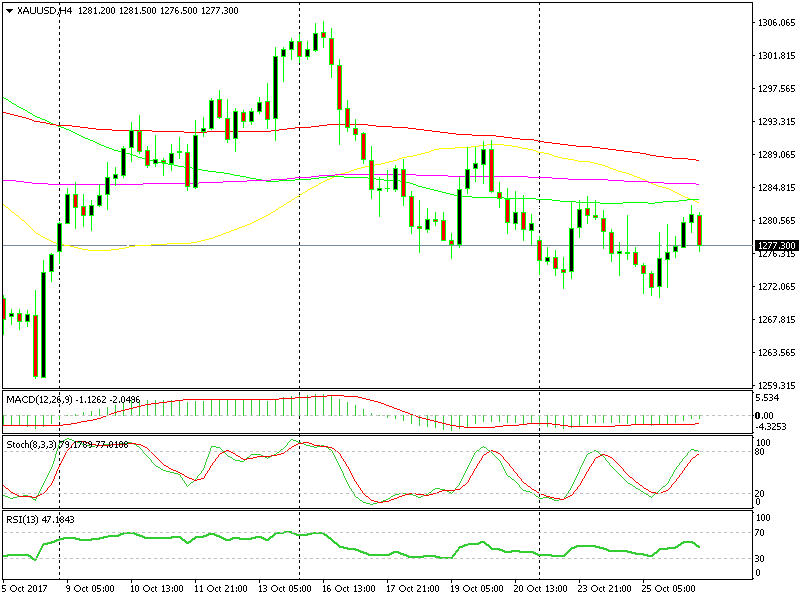 The H4 chart is oversold again and the 100 SMA (green) is providing resistance again
Looking at the H4 Gold chart above, we can see that Gold has turned lower when the stochastic indicator reached overbought levels. In the first occasion, the 50 SMA (yellow) and the 100 smooth MA (red) provided resistance on top.
In the second case, it was the 100 simple MA which provided resistance. Today it seems like we will see a repetition of the second case. The 100 SMA (green) provided support on top, while stochastic is overbought and it is heading down.
According to this chart, the downside potential is great, so if Gold falls to the $1,270 lows then I suggest that you remove take profit and place stop loss at breakeven. This way you will have a risk free forex trade, but let’s see Gold move lower first.
- Check out our free forex signals
- Follow the top economic events on FX Leaders economic calendar
- Trade better, discover more Forex Trading Strategies
- Open a FREE Trading Account


