EUR/USD – Once Support Now Resistance?
Last Friday EUR/USD broke below 1.16 for the first time in nearly four months. But that wasn’t the big level for EUR/USD. The big level c
Last Friday EUR/USD broke below 1.16 for the first time in nearly four months. But that wasn’t the big level for EUR/USD. The big level comes about 60 pips higher.
The 1.1660-70 level has been acting as support in the last few months since this forex pair broke above 1.1717, which was another big level in itself. The 1.1660-70 level has acted as support and has discouraged EUR/USD sellers a couple of times during this time so I expect it to discourage the buyers from pushing higher now that it has been broken.
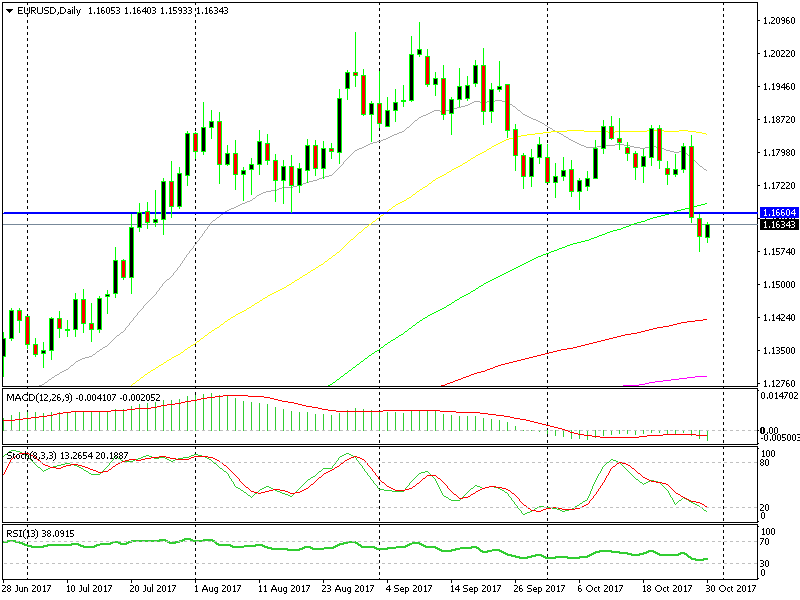 The 1.1660 level is a massive support/resistance area.
The 100 SMA (green) on the daily chart is standing a handful of pips above there, so that should provide some extra strength to that level. By the time we reach up there, if we do, then the H4 chart will be overbought which will be another indicator going in favour of sellers.
Although, in the 1.1650 area, we have the 50 SMA waiting on the hourly forex chart. The hourly chart is already overbought and the buyers are having trouble pushing any higher, so we might as well pull the trigger right there. But, I think we should let this hourly candlestick close before taking action. It will help us make a better judgement, so hang on for a little while guys.
- Check out our free forex signals
- Follow the top economic events on FX Leaders economic calendar
- Trade better, discover more Forex Trading Strategies
- Open a FREE Trading Account
- Read our latest reviews on: Avatrade, Exness, HFM and XM
Related Articles


Sidebar rates
Related Posts
