This Euro Chart Looks Bearish to Me
We opened a sell forex signal in EUR/USD a while ago as you might have noticed by the alert if you are a premium member. The hourly chart l
We opened a sell forex signal in EUR/USD a while ago as you might have noticed by the alert if you are a premium member. The hourly chart looks a bit confusing, especially after the last couple of hours as this forex pair drifted lower from the 100 SMA.
Although, the price is back up at that moving average. But, the title of this update doesn’t refer to the H1 EUR/USD chart. In fact, we are looking at the H4 chart, which to me, looks sort of bearish.
We see on this chart that EUR/USD made a big bearish move late last week after consolidating for a couple of weeks. Since Friday last week, this pair has retraced higher to the 1.1660s.
The 20 SMA (grey) is standing just above there, and it stopped the buyers right there. But, it wasn’t this moving average which lured me to try a short trade on this forex pair. The 1.1660 level is a long-term support area, which has now turned into resistance.
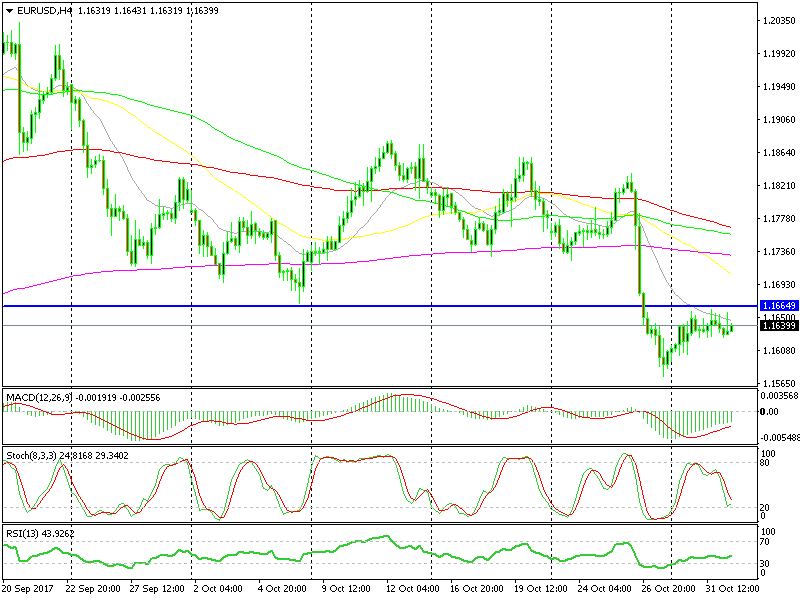
The 20 SMA is adding extra strength to the big 1.1660 level.
EUR/USD slipped lower a couple of times from above 1.20 in the last few months, but both times the selling stopped right at this level. Third time's the charm, so it finally got broken the third attempt. Now, it is providing solid resistance, and we thought that it would be a straightforward trade selling. Let’s see how it will progress from here on.
- Check out our free forex signals
- Follow the top economic events on FX Leaders economic calendar
- Trade better, discover more Forex Trading Strategies
- Open a FREE Trading Account
- Read our latest reviews on: Avatrade, Exness, HFM and XM
Related Articles


Sidebar rates
Related Posts
