Gold Is Stuck Between Two Moving Averages, but with A Bearish Bias
Gold has been sliding lower in September which can be considered a trend reversal. In October, the price made a retracement higher during t
Gold has been sliding lower in September which can be considered a trend reversal. In October, the price made a retracement higher during the first half, but then it turned down again, so it looked like the downtrend would resume.
But, the 100 SMA (red) on the daily Gold chart has provided solid support. Gold sellers have tried several times this week to break it but without success. Now, Gold is stuck between two moving averages on the daily chart, the 100 smooth MA (red) on the bottom and the 100 simple MA (green) at the top.
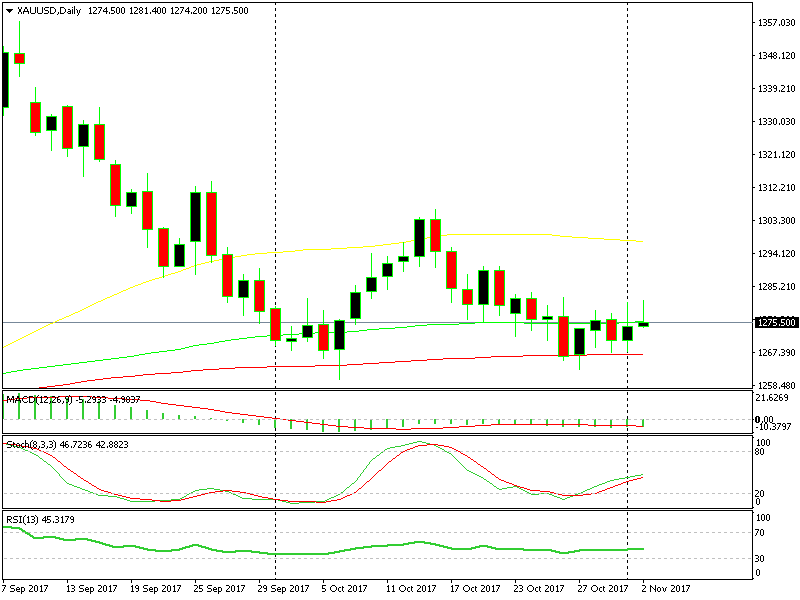 The range looks tight on the daily Gold chart.
We have had quite a few inning Gold signals during this period, selling near the top around the $1,280 level. We opened another sell signal yesterday near the top, but the FOMC statement in the evening confused Gold traders, so right now we are in no man’s land.
Every time stochastic has been overbought, Gold has turned lower.
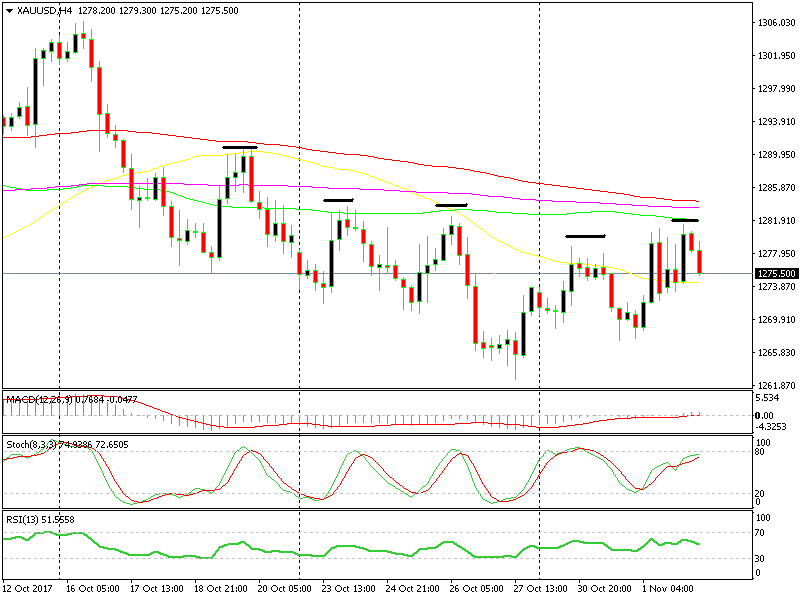
Gold has been trading between $1,273 and $1,281 since then and in the H4 chart, we see that Gold is stuck between two other moving averages here. The 100 simple MA is playing resistance on top while the 50 SMA (yellow) is providing support on the bottom.
The H4 chart looks much better as it is heading down, while stochastical is almost overbought, so chances are that it will head down, too. Right now, our Gold forex signal is in profit, so we’re on the right track. I say, let’s hold it still, hopefully, the sellers will get more confident as the price slips lower.
- Check out our free forex signals
- Follow the top economic events on FX Leaders economic calendar
- Trade better, discover more Forex Trading Strategies
- Open a FREE Trading Account


