These GBP Charts Look Very Bearish. Can UK Services Report Turn Things Around?
Yesterday the Bank of England (BOE) raised the interest rates after a very long time. According to forex textbooks, GBP should have at leas
Yesterday the Bank of England (BOE) raised the interest rates after a very long time. According to forex textbooks, GBP should have at least made a decent jump. But, GBP tumbled hard about 200 pips lower.
There are two reasons for this. First, the rate hike was accompanied by a dovish statement and pressure from Chairman Carney. Second, there’s not much to do now after this, so there’s no incentive for the market to keep buying the GBP.
The buyers gave up at the previous support level.
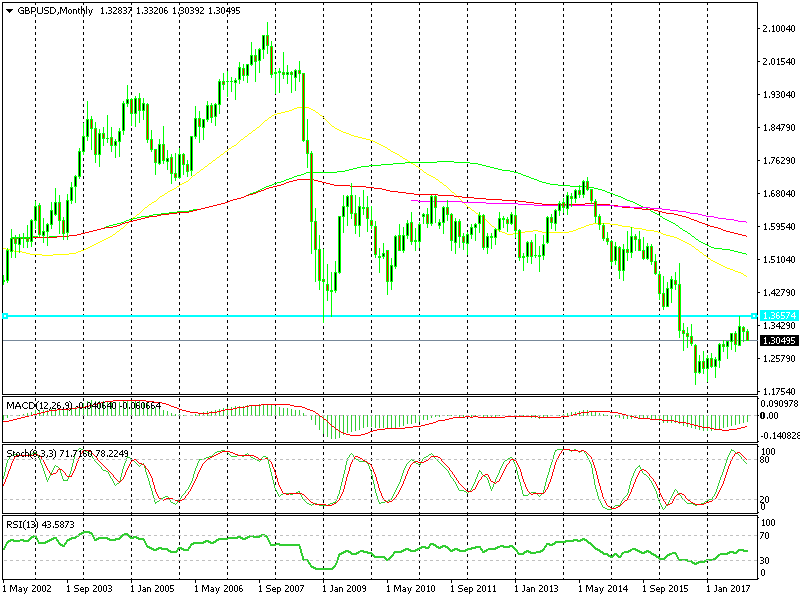
So, GBP turned lower and now the major GBP/USD charts look pretty. The monthly chart is turning lower after failing at resistance around 1.3650s, which used to be support back in March 2009, as you can see above. There’s also plenty of room for stochastic to run until it becomes oversold.
The 20 SMA is being challenged at the moment.
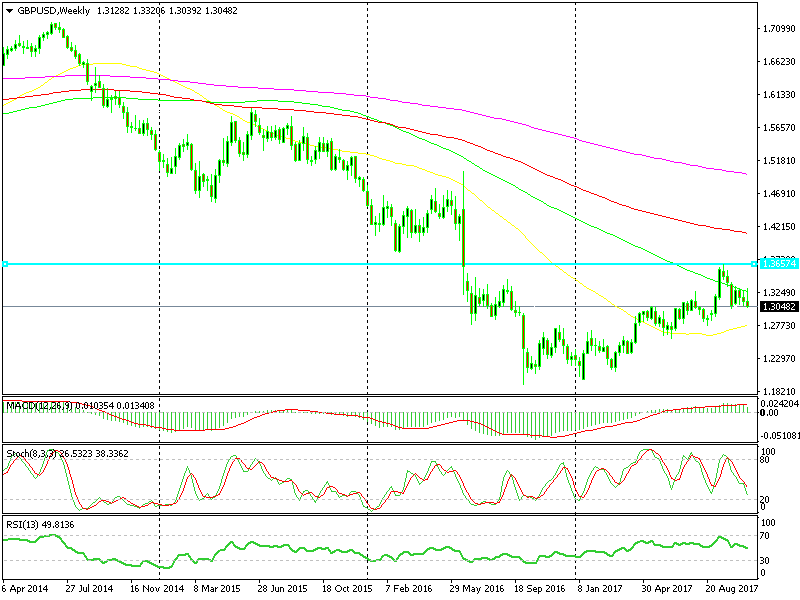
The weekly chart looks bearish as well. The fourth wave of the Elliot Wave Pattern looks to be over, so next comes the fifth wave, which is supposed to go down as a continuation of the downtrend. The sellers are targeting the 20 SMA (grey) which should get broken this time.
Although, the UK services PMI report is to be released shortly and there’s a very slight chance that it might turn things around for GBP. This sector has been around the region of 53 PMI points in the last several months, so there’s little chance that we see a considerable change this time. But if that happens, the number has to be close to 60 PMI points to have a marginal impact on the GBP – let’s see.
- Check out our free forex signals
- Follow the top economic events on FX Leaders economic calendar
- Trade better, discover more Forex Trading Strategies
- Open a FREE Trading Account


