S&P and Nikkei Completing A Retrace on An Uptrend – Looking for A Place to Go Long
The stock markets have been trading in a bullish trend for about a decade. The trend is very visible on bigger timeframes as well as in smaller timeframes, such as the H4 charts. This means that the uptrend is strong as well.
Overnight though, most of the stock indices tumbled lower in what seems to be a temporary pullback. Nikkei and S&P are making a pullback from the highs and they have retraced lower to some interesting levels.

Looks like a great place to buy, doesn't it?
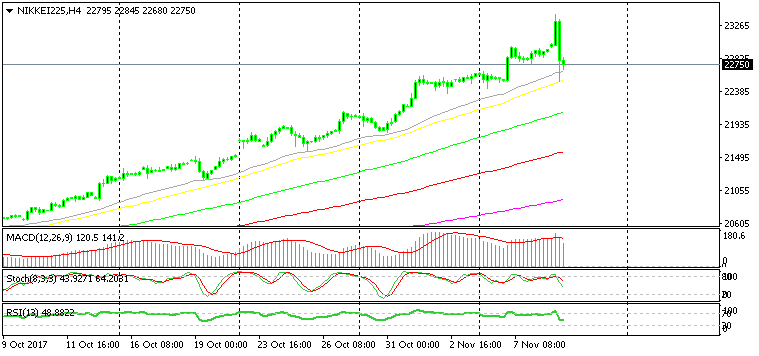
As you can see from the H4 forex chart above, Nikkei jumped higher overnight, but it reversed back down and the H4 bearish candlestick is twice as big as the previous bullish one.
But, the decline stopped right at the 50 SMA (yellow). This moving average has been providing support previously, but in the last few weeks, the 20 SMA (grey) has taken its place, which means that the uptrend has picked up the pace.
Now, the price is sitting just above the 20 SMA. The picture is the same in the S&P chart as well. So, this looks like a good opportunity to go long on these two indices. But, the stochastic indicator is not oversold yet, which is what is keeping me from buying right now.
I’ll try to be patient and wait for the stochastic to reach the oversold area, although I don’t want to miss this opportunity. So, get ready to buy one of these two stock indices soon.


