Selling EUR/CHF on Contradicting Charts
After having a look at the H1 and H4 charts in EUR/USD, we decided to open a sell forex signal here. These charts are sort of contradictory
After having a look at the H1 and H4 charts in EUR/USD, we decided to open a sell forex signal here. These charts are sort of contradictory, but we concluded that we have to go with the bigger timeframe chart.
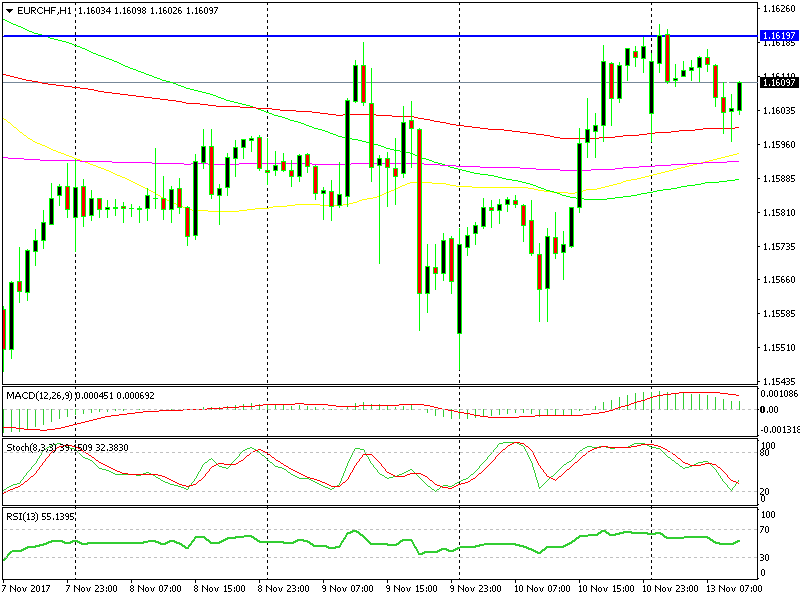
The doji candlestick looks a bit dodgy to sellers.
The H1 chart above looks sort of bullish: It is oversold, and it is turning higher currently. The previous hourly candlestick closed as a doji, which is a reversing signal after a trend.
Today, this forex pair has been trending lower during the Asian trading session, so now the doji candlestick is pointing towards a possible reversal. Although, even if we see a reverse higher, the area around 1.1620 is a decent resistance area, so our signal is a bit protected on the upside.
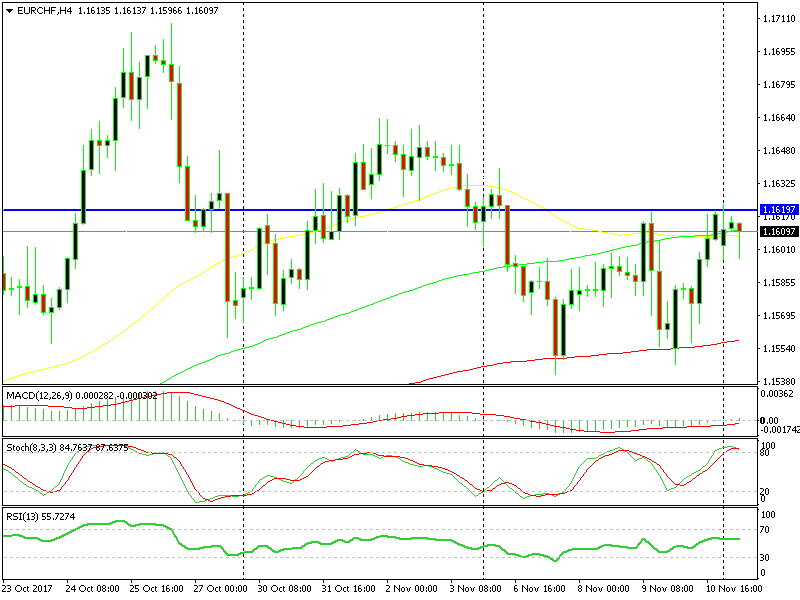
The H4 chart is overbought and looks like it’s turning down.
On the H4 chart, the picture seems a bit different. On this timeframe chart, the price is overbought and stochastic is now turning lower. The buyers failed to break above resistance on Friday evening and early this morning, so it looks like the price is heading lower.
Although, we are right at the 100 simple MA (green). If we are to move down, we have to break and close below this moving average. Only then can we target the 100 smooth MA (red). Both charts point to a different direction, and we decided to go with the bigger timeframe chart.
- Check out our free forex signals
- Follow the top economic events on FX Leaders economic calendar
- Trade better, discover more Forex Trading Strategies
- Open a FREE Trading Account