WTI Oil Jumps off One MA, Now Faces another MA. Who’s Selling?
WTI (West Texas Intermediate) Oil bears put up a fight this week after a strong uptrend in the last month or so. They managed to form a pul
WTI (West Texas Intermediate) Oil bears put up a fight this week after a strong uptrend in the last month or so. They managed to form a pullback and retrace Oil prices a couple of Dollars lower.
But, the retrace stopped right at the 200 smooth moving average (MA) on the hourly chart. It’s not just the 200 moving average on the hourly forex chart which has stopped the sellers. The 100 SMA on the H4 chart and the 20 SMA on the daily Oil chart come at the same level. They helped provide support and stop the decline.
 The 50 SMA doesn't look too far.
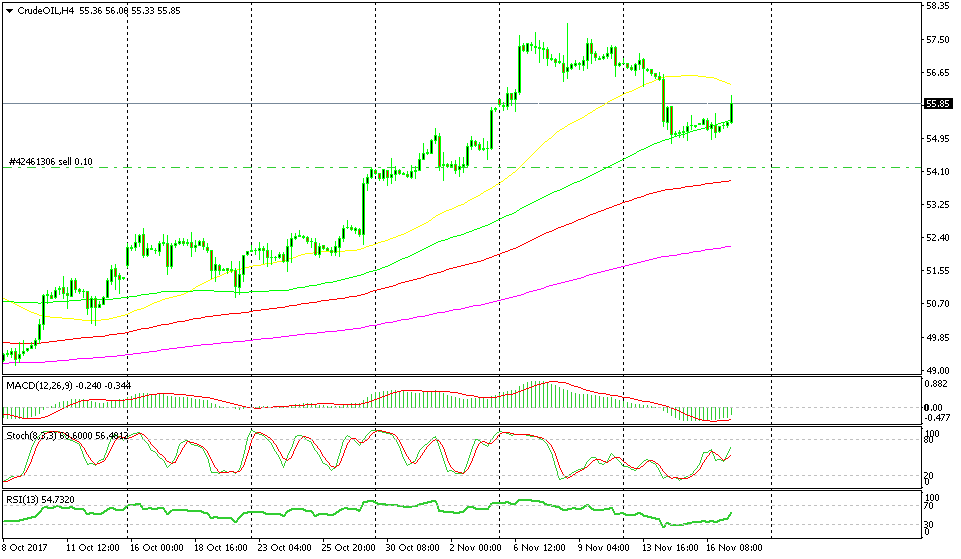
Now Oil is up nearly $2 from the lows and is headed towards another interesting technical indicator. As you can see from the H4 Oil chart above, the 50 SMA (yellow) is standing above and today the price is headed to this moving average.
At the moment, the 50 SMA is around 40 ticks above the current price and the stochastic indicator is reaching the oversold area. By the time we reach the 50 SMA, the stochastic indicator will be oversold.
Trade Idea: This would be a great bearish chart setup, since this moving average has provided support previously and now it should turn into resistance. I’m thinking of opening a sell forex signal up there around the $56.40-50 level, anyone coming?
- Check out our free forex signals
- Follow the top economic events on FX Leaders economic calendar
- Trade better, discover more Forex Trading Strategies
- Open a FREE Trading Account