The 100 SMA Has Been A Great Indicator to Trade EUR/USD Recently
The 100 SMA has been a pretty good indicator lately. It has provided support and resistance many times before if you want to trade EUR/USD
Yesterday we had a winning forex signal in EUR/USD. We decided to sell this pair at the 100 SMA (green) as it was retracing higher after it opened with a gap lower.
I don’t exactly remember the trade setup where we based our signal yesterday, but one thing is clear on this hourly chart, the 100 SMA has been a great place to buy or sell this pair.
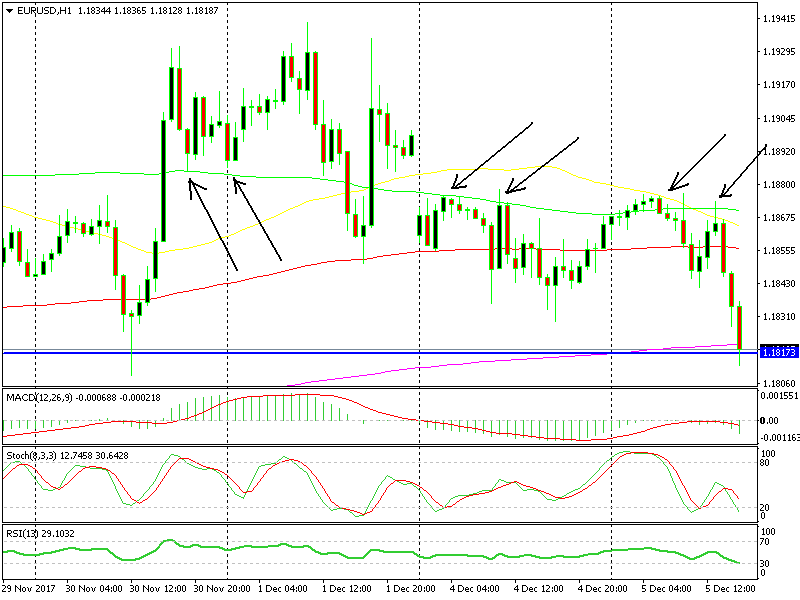
You could have bought or sold EUR/USD several times at the 100 SMA
As you can see from the H1 EUR/USD chart, this moving average was providing support on Thursday and Friday last week. Although, we didn’t open a buy signal against it.
Yesterday the price opened lower as we mentioned above and since then this moving average has been a nightmare for buyers. You see that the price has been knocking on it several times in the last two days, but every time the price has reversed back lower.
The latest rejection happened a few hours ago and this time it looks real. The reverse down seems quite strong. The 200 SMA (purple) and the support from last week at the 1.1810-20 area are under threat and it looks like this time they will both be broken.
The US Dollar is finding some bids at the moment so it is turning bullish, which means that EUR/USD is turning even more bearish. We also have a long term sell forex signal in this pair, so we are bearish as well.
- Check out our free forex signals
- Follow the top economic events on FX Leaders economic calendar
- Trade better, discover more Forex Trading Strategies
- Open a FREE Trading Account