Gold Sideways – Head & Shoulder Pattern Ready To Play!
The interest rate hike from the US central bank isn't helping the dollar much. Well, it's not a surprise us as we discussed it...

The interest rate hike from the US central bank isn’t helping the dollar much. Well, it’s not a surprise us as we discussed it before the news release. Due to its direct correlation with Gold, the investors are making it bullish. But check out how I’m looking to trade Gold today…
Technical View of Gold
The outlook for Gold remains mixed. The RSI and Stochastics are signaling that Gold is heavily overbought in the hourly chart. At the same time, it’s heading north to complete a right shoulder at $1,258.
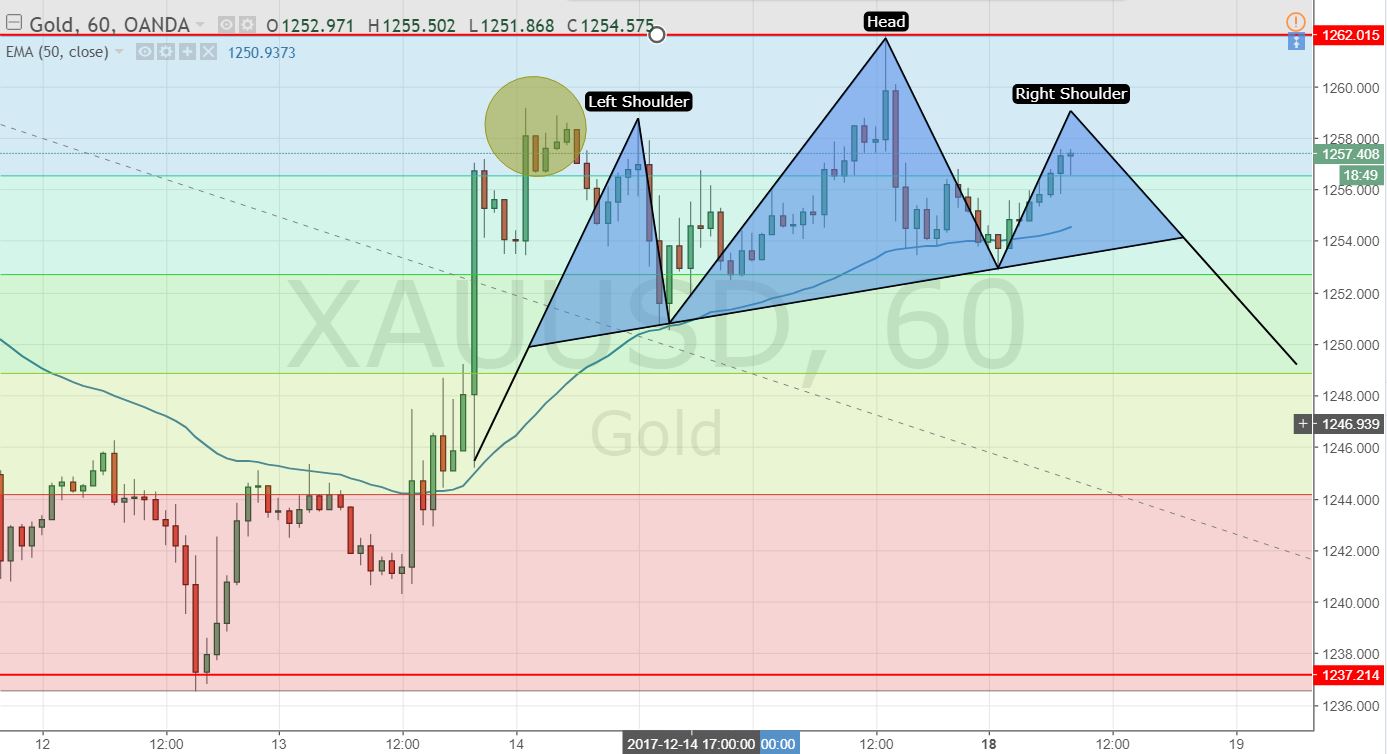
Gold – Hourly Chart
Gold seems to trade sideways below $1,259 to $1,250. So, here is our chance to cash the opportunity. As soon as the market complete right shoulder near $1,260, we can go short for the target of $1,254 and $1,252.
Gold // XAUUSD – Trading Idea
I have just shared a forex trading signal to open a buy above $1,255 with a stop below $1,253 and target of $1,259. Later, I will be looking to enter short below $1,260 with a stop above $1,263 to target $1,254. Good luck!
- Check out our free forex signals
- Follow the top economic events on FX Leaders economic calendar
- Trade better, discover more Forex Trading Strategies
- Open a FREE Trading Account
- Read our latest reviews on: Avatrade, Exness, HFM and XM
Related Articles


Sidebar rates
Related Posts
