Interesting This H4 Bitcoin Chart for Buyers


We are long on Bitcoin since last Friday when we opened a long term buy forex signal. The price has tumbled, then surged and tumbled again during this time, but the H4 Bitcoin chart looks sort of bullish to me right now and one of the reasons is the 100 smooth moving average (SMA) in red.
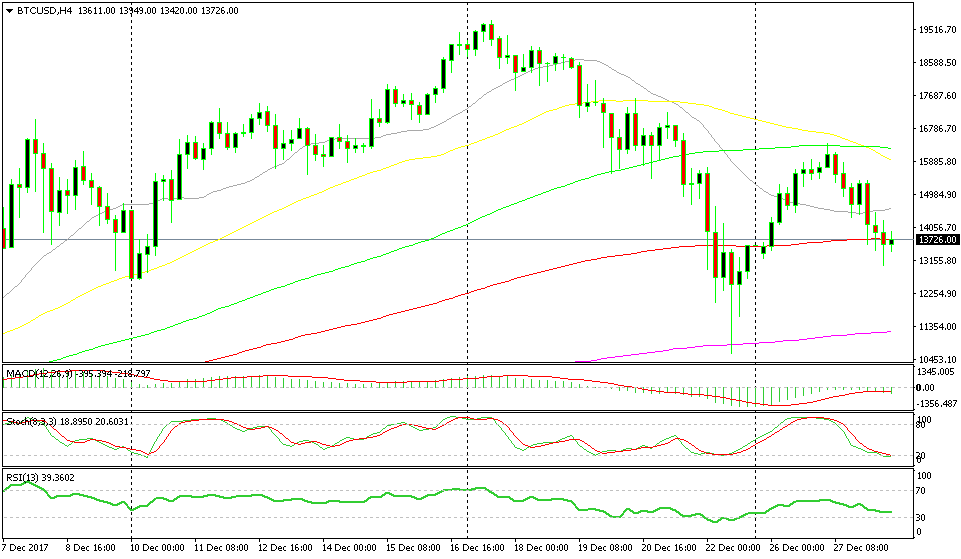
Bitcoin is trading between two moving averages now.
As I often mention, moving averages are great indicators in pointing out reverse levels. They are very visible and forex traders use them a lot to be honest, so they provide solid support and resistance.
You can see that on the H4 chart above; the decline stopped right at the 200 SMA (purple) on Friday. Then, as the price reversed higher, the 100 simple MA (green) came into play. It provided resistance on the top side yesterday and reversed the price back lower.
Now, we are facing another moving average. The 100 smooth moving average (red) is standing around the $13,700 level, where the price is at the moment. It has been pierced a few times, but the area around it is providing solid support.
That’s not all though. The stochastic indicator is oversold on this timeframe chart. According to forex textbooks, on a downtrend, the pullback is over when stochastic is oversold. Now stochastic is oversold and the price is above Friday’s low, so the trend is still up.
It seems like the price will resume the uptrend soon, so if you are out, you can consider going long here on Bitcoin.