Remember That Triangle in Bitcoin? It’s Providing Support Now
We have a live signal in Bitcoin, if you aren’t following our fx signals. It is a long term signal, which we opened before Christmas when the cryptocurrency market was going through a flash crash.
We went long just above the $15,000 level. Although we could have waited a few hours and entered at a much better price since Bitcoin fell to around $10,000.
We’re not bad with this signal though; Bitcoin is trading at around $15,400-500 at the moment, so our signal is in profit. Yesterday, Bitcoin was trading above $17,000. At that time, we were about 2,000 pips in profit, but I digress.

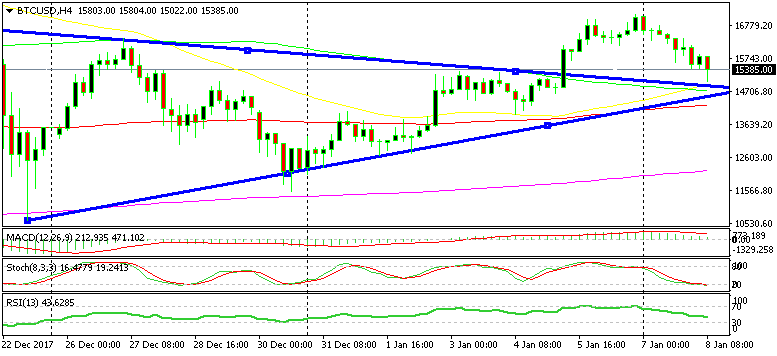
We’re back at this triangle that we pointed out last week
A few days ago, we highlighted a chart formation in Bitcoin that looked like a triangle. I mentioned that a break was going to happen soon because the triangle was getting narrower. The break happened to the upside as we had anticipated.
In the last few days, the price has moved away from that triangle, but now it has returned back to it. The upper line of the triangle used to provide resistance, but now it is providing support.
Besides the triangle, the 50 SMA (yellow) and 100 SMA (green) have caught up with the price as well now. They stand at around $15,000 now, so they are adding more strength to this level. The stochastic indicator is oversold as well, so the retrace lower looks to be over. Other major cryptos have retraced lower as well, but they also are facing some important levels. So, I think that a reverse higher is coming up soon, fingers crossed.


