The Reverse Is Taking Shape in Bitcoin
I mentioned a few hours ago in the US brief that Bitcoin was trading more on the daily chart than on the H4 chart.

I mentioned a few hours ago in the US brief that Bitcoin was trading more on the daily chart than on the H4 chart. The reason for this is that it ignored the 100 SMA (red) which was providing support yesterday and broke below it. It also ignored the pins and dojis it made on this timeframe chart.
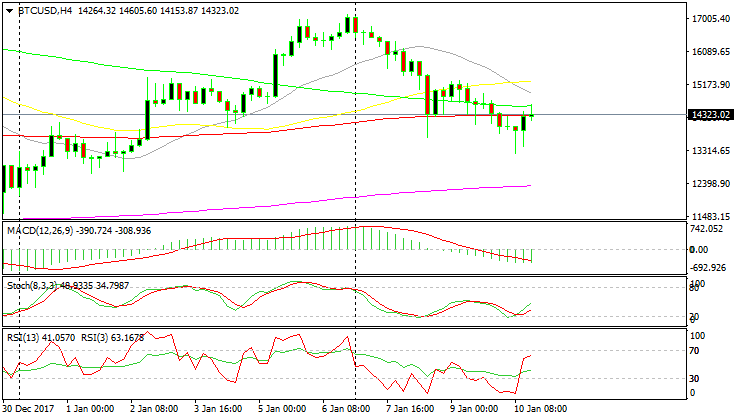 The setup looks pretty bullish on the H4 chart
Although, it has formed a hammer now and it looks like this time it is going to work out. The hammer candlestick was followed by a bullish candlestick. By the looks of it, it seems as this H4 candlestick is going to close as another bullish one.
But my bullish bias is based on the daily chart, as I highlighted in the brief. The daily candlestick is closing as a pin, which is a reversing signal. If the daily candlestick closes as it is, then this will be a strong bullish signal.
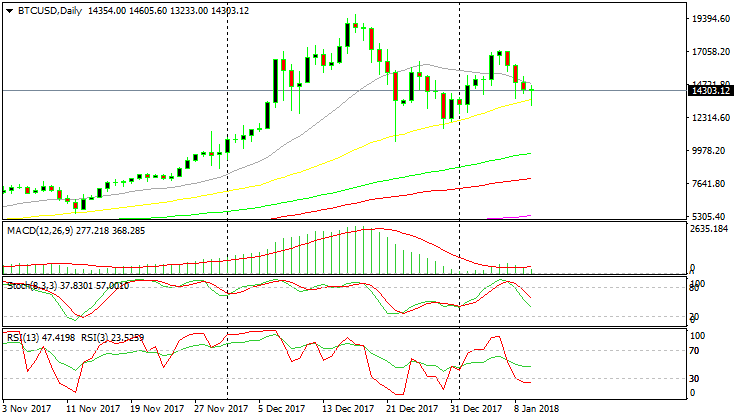
The pin and the 50 SMA will be strong bullish signals
But the main indicator I’m positive about our buy signal here is the 50 SMA (yellow). That moving average has provided support in the past few months and it looks like is doing that again now. The price bounced off it and now Bitcoin is closing the day where it opened about $1,200 higher. So, we remain long on Bitcoin.
- Check out our free forex signals
- Follow the top economic events on FX Leaders economic calendar
- Trade better, discover more Forex Trading Strategies
- Open a FREE Trading Account