Long Terms Sell Forex Signal on AUD/USD Based on the Weekly Chart
Just as December of 2017 was, January of this year has been terrible for the Buck so far. We can see, based on the weekly AUD/USD chart, tha
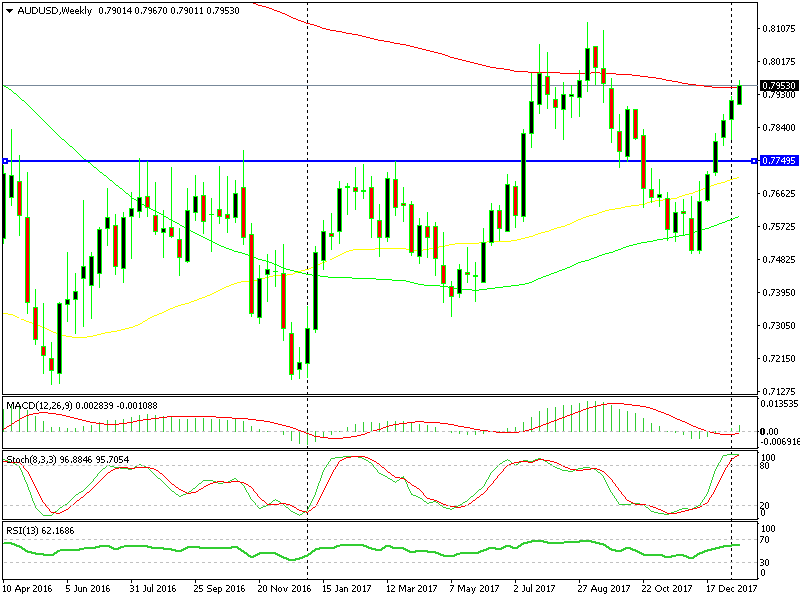
Just as December of 2017 was, January of this year has been terrible for the Buck so far. We can see, based on the weekly AUD/USD chart, that this forex pair has had six consecutive bullish candlesticks. That is to say, it has climbed more than 450 pips during this period.
This bullish run has reached a limit on this timeframe chart
It has now reached a level of which it looks like the buyers will finally meet some sellers, and it’s about time!
The stochastic indicator is severely overbought. This pair has reversed lower every time the stochastic indicator has been overbought on the weekly chart, and we can see based on stochastic that the chart history is in favour of shorts.
The technical indicator that really persuaded us to open a long term forex signal here is the 100 SMA (red). This moving average had provided resistance twice in 2017, and the buyers have pushed above this moving average several times. The sellers, on the other hand, have returned and have sent this pair lower.
Could this be the case again now? With high hopes, we have opened our forex signal.
We know that the US Dollar is under heavy selling pressure. Butat some point this must end- if the market sentiment turns positive for the Buck, then AUD/USD will be heading down. I believe that we will see a decent retrace lower in the near future. That is to say, a few days or even weeks.
- Check out our free forex signals
- Follow the top economic events on FX Leaders economic calendar
- Trade better, discover more Forex Trading Strategies
- Open a FREE Trading Account
- Read our latest reviews on: Avatrade, Exness, HFM and XM
Related Articles


Sidebar rates
Related Posts
