Long EUR/GBP at the 200 SMA, Targeting the Top of the Range
For the past few days, the EUR/GBP has been trading in a 50 pip range, finding support at the 200 SMA (purple) on the hourly chart at the bo
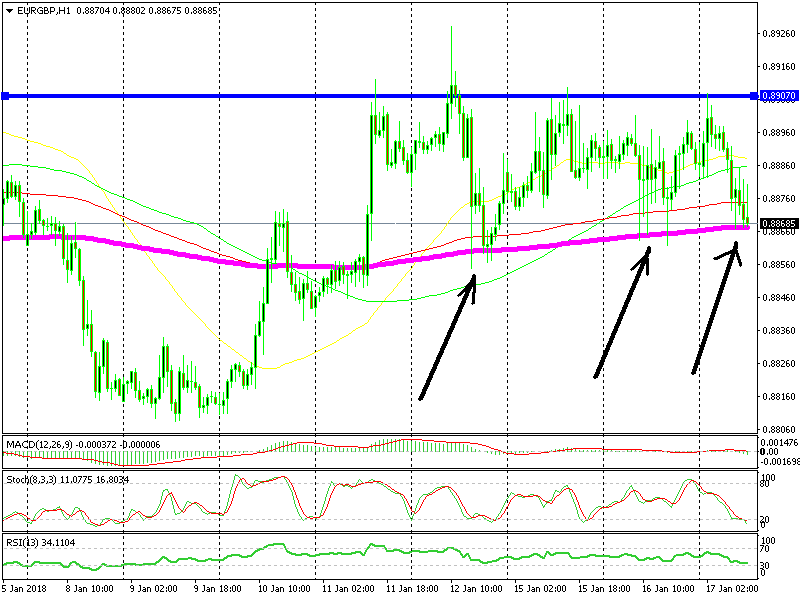
For the past few days, the EUR/GBP has been trading in a 50 pip range, finding support at the 200 SMA (purple) on the hourly chart at the bottom, while at the top the area around 0.8900-10 has been providing resistance.
The EUR/USD rallied strongly last week, taking the EUR/GBP higher. The GBP, however, caught up after some soft Brexit comments from the Eurozone, and as a result the pair has been moving up and down in this 50 pip range.

The 200 SMA is holding on for now
We moved to the top of the range earlier, but are now back at the bottom. It looks like this is a good opportunity to go long!
The 200 SMA
Based on this H1 EUR/GBP chart, we decided to go long, and opened a buy forex signal right above the 200 SMA, a technical indicator which has been providing solid support lately. That being said, it is likely that it will continue to provide that support.
The Stochastic
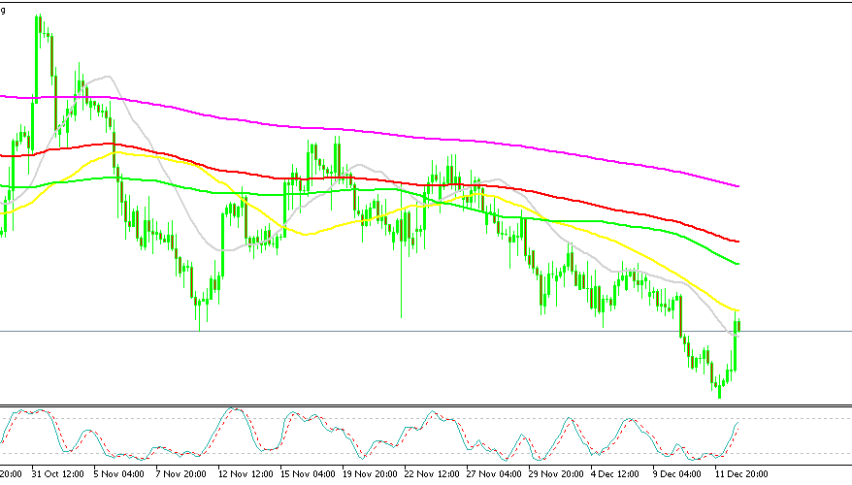
The stochastic indicator is also oversold, proving to be yet another bullish reversing signal. By switching to the H4 chart, you can see that the 100 SMA (red) is providing support at the same levels that the 200 SMA stands on the H1 chart.
It seems that, for the moment, the decline has come to a halt. Here’s hoping that the buyers return, as the price is now at the bottom of the range.
- Check out our free forex signals
- Follow the top economic events on FX Leaders economic calendar
- Trade better, discover more Forex Trading Strategies
- Open a FREE Trading Account


