Forex Signals US Session Brief, January 23 – The Downside in Cryptocurrencies Is Not Over
Cryptocurrencies bumped higher at the end of last week. But the price action on Sunday brought the buyers back to earth as the downside...
Cryptocurrencies bumped higher at the end of last week. But the price action on Sunday brought the buyers back to earth as the downside resumed, which is continuing further today. The US Dollar is still trying to make up its mind today, but the fall has stopped for now.

Digital currencies are on the slide again today
What’s Going on in Forex?
EUR/USD is almost unchanged on the day. This pair lost about 50 pips in the morning, but is climbing higher at the moment. So, the USD is not losing anymore ground against the Euro. Judging by the price action in the last two weeks, I can say that a top has been put in place for this pair around the 1.23 region. We will take a better look at this pair in the following updates though.
The GBP on the other hand, is about 50 pips lower against the Buck today. GBP/USD tried to break the big level at 1.40 which we talked about in one of our forex updates this morning. But, this round level rejected the price. Now, we don’t know if this is just an initial rejection before the break or whether it is a reversal. But, this is a good place to open a long term sell forex signal.
Commodity Dollars are also lower against the USD today, apart from the Kiwi. The Aussie took a sudden dive this morning while USD/CAD is 40 pips higher as NAFTA (North American Free Trade Agreement) talks are weighing on the Canadian Dollar. That’s the reason we bought the NZD against the USD.
USD/JPY is in a world of its own today. The Bank of Japan (BOJ) kept the interest rates unchanged last night. USD/JPY jumped at first, but it failed to break the 100 SMA on the hourly chart. It reversed a few hours ago and it is now near the lows. I suppose, the market was expecting some dovish rhetoric from the BOJ.
Cryptocurrencies Can’t Get Their Act Together
Cryptocurrencies started reversing higher on Wednesday after the second leg of the downtrend which began the week before Christmas. They moved higher in the next few days with Bitocin gaining about $4,000.
But on Sunday, the price started reversing again, this time lower. Having found support at the 100 SMA (green) on the daily chart and having formed a few bullish candlesticks, I thought that this was the time that cryptos resumed the epic uptrend.
Sunday’s candlestick killed those hopes though. It formed an engulfing bearish candle, which was bigger than the previous bullish candlestick, including the wick/shadow. Cryptos continued to slide yesterday but the daily candlestick in Bitocin closed above the 100 SMA, which was a ray of hope for buyers.
Today we have moved below that moving average and the price is flirting with the $10,000 level. It moved below this level briefly but it is back above now. This doesn’t look very bullish to me; the 100 SMA has been broken and the $10,000 doesn’t look that scary now.
Actually, looking at the bigger picture, we can see an Elliott Wave chart pattern being formed here. According to this chart pattern, we are now in the fifth wave of a bearish move. The fifth wave is the last one in this pattern.
So, Bitocin should resume the uptrend after this move. The problem is how long is this last move going to last and where will it end. According to the Elliot Wave strategy, this last move should take us below the lows of the third wave. If the price follows the pattern, then the 100 smooth MA (red) is the next target. Although, we still have to close below the $10,000 level today. Otherwise, the sellers might get discouraged and the buyers will jump in.
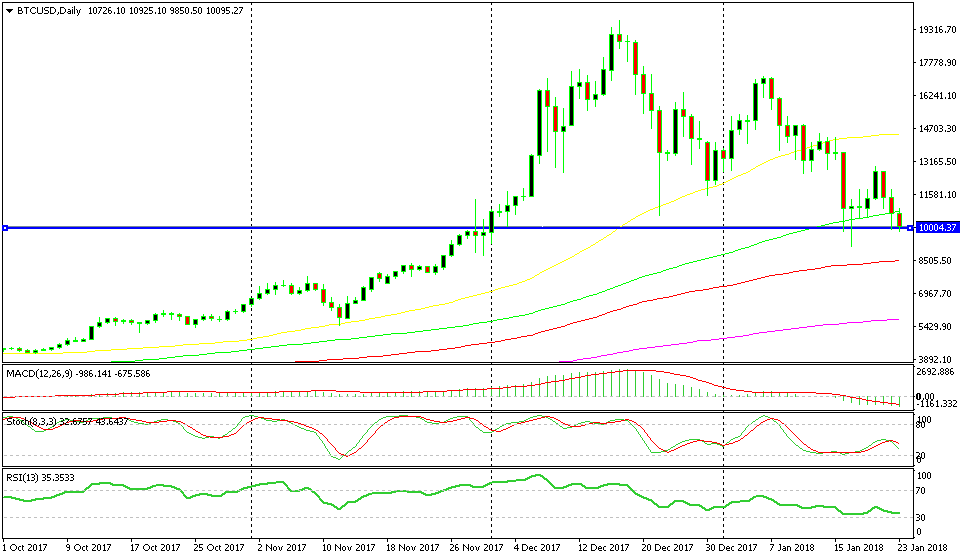
We will see if Bitcoin will close below the $10,000 today
Trades in Sight
Bearish EUR/GBP
- The trend is strongly bearish
- The 0.88 level used to be support
- The 50 SMA stands at 0.88
- Stochastic is almost overbought
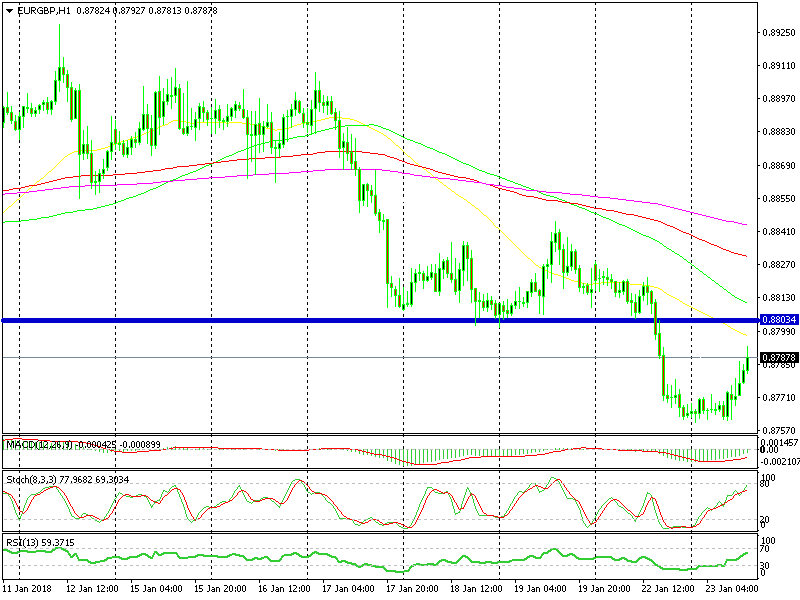
Getting ready to sell at the 50 SMA
Yesterday, this forex pair broke below the long term support level at 0.88. That level should turn into resistance now. The 50 SMA (yellow) is standing up there too, so it should provide resistance as well. Besides that, the stochastic indicator is almost overbought, which means that the retrace up is almost over.
In Conclusion
Again, the economic data is very light this afternoon so we will have to look elsewhere for direction. At least, the US government shutdown will be over. Perhaps, that’s the reason that the USD is not losing anymore ground today.
- Check out our free forex signals
- Follow the top economic events on FX Leaders economic calendar
- Trade better, discover more Forex Trading Strategies
- Open a FREE Trading Account
- Read our latest reviews on: Avatrade, Exness, HFM and XM
Related Articles


Sidebar rates
Related Posts
