Shorting GBP/USD Below the 50 SMA
GBP/USD has reversed lower, after absolutely surging in the first half of last week. It lost nearly 400 pips as it reversed from the top...
GBP/USD has reversed lower, after absolutely surging in the first half of last week. It lost nearly 400 pips as it reversed from the top last Thursday, falling below 1.40 today. Over the last few hours, however, the Buck has lost considerable ground across the board, as the Forex market is largely affected by the yield market.
The jump of the last few hours has taken presented us with interesting levels for sellers. That being said, we have decided to give this Forex pair a try, abd opened a sell signal. Let’s have a look at the chart setup.
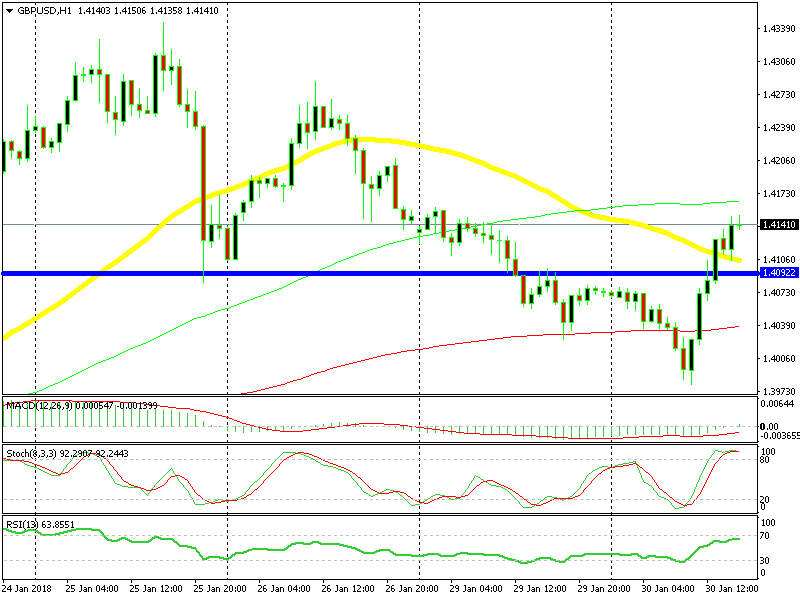
The 50 SMA has been broken now but the 100 SMA remains
As we can see, the price is currently trading below the 50 SMA (yellow). This moving average had provided support before, however, it seems that it is now becomingresistance. The price climbed above the 50 SMA a few moments ago, but the sellers returned, and we are now back below this moving average.
The stochastic indicator is currently overbought on the hourly chart, meaning that the retrace higher should conclude soon. The previous hourly candlestick closed below the 1.41 level, which was supposed to provide resistance.
The markets have been quite difficult to read and trade today. The price has broken above 1.41 pretty easily, and we were forced to move our stop loss (SL) above the 100 SMA (green). Let’s hope the USD finds its footing again soon.
- Check out our free forex signals
- Follow the top economic events on FX Leaders economic calendar
- Trade better, discover more Forex Trading Strategies
- Open a FREE Trading Account