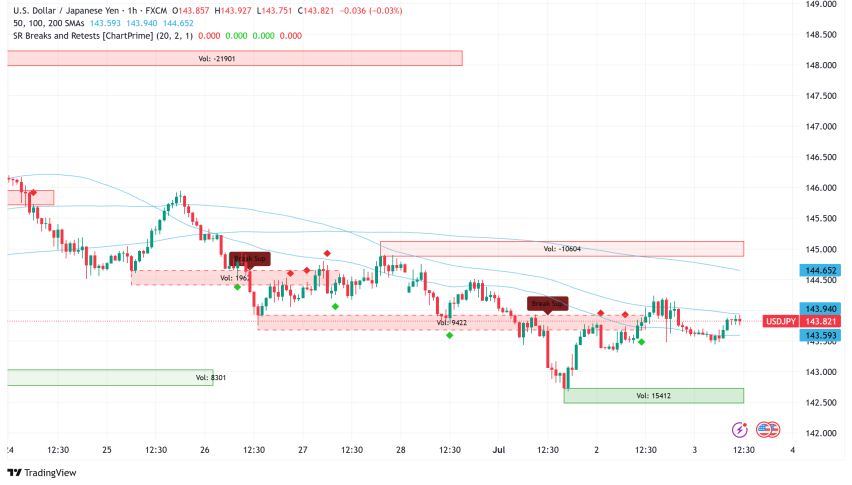
Fibonacci Resistance Holds For USD/JPY
In the wake of Janet Yellen’s farewell tour as acting U.S. Federal Reserve (FED) Chair, the greenback is on a roller coaster.

The last 24 hours have been hectic for the USD. In the wake of Janet Yellen’s farewell tour as acting U.S. Federal Reserve (FED) Chair, the greenback is on a roller coaster. From the perspective of a short-term trader, this can be a great opportunity to pad the account balance. In Wednesday’s FED recap, I outlined a short trading plan for the USD/JPY.
Thus far, the 38% Fibonacci retracement on the daily chart (109.50) has withstood several tests. As of this writing, the trade is in the green by 25 pips, after a maximum positive move of 27. This trade is in a good position to hit the 30 pip profit target (109.20).
USD/JPY Technicals
Stop loss location is one of the most important aspects of designing a rock-solid trading plan. Most of us focus on profit targets — but understanding when a trade is a loser can be much more important to long-run profitability.
++10_24_2017+-+2_1_2018.jpg)
In my view, there are two crucial levels that will define today’s action:
- Resistance(1): 38% Fibonacci retracement of current wave, 109.50
- Support(1): 78% macro Fibonacci retracement Sept. Low/Nov. High, 108.94
Overview: Although this recommendation took a large early draw to 109.74, it has performed well. The initial stop of 109.81 has proved to be valid. It is now time to reduce liabilities and risk. At this point, either taking 20+ pips profit or moving the stop loss to breakeven is a good idea.
Finishing off a good trade properly can be a challenge. In my opinion, taking profits and limiting risk is a good rule of thumb when dealing with trades heavily in the green. Ultimately, the decision falls upon the trader.
- Check out our free forex signals
- Follow the top economic events on FX Leaders economic calendar
- Trade better, discover more Forex Trading Strategies
- Open a FREE Trading Account


