The 50 SMA Has Now Turned Into Resistance on EUR/USD
EUR/USD has been trading in a strong uptrend for a long time. The technical indicator which held the uptrend in place in recent weeks...

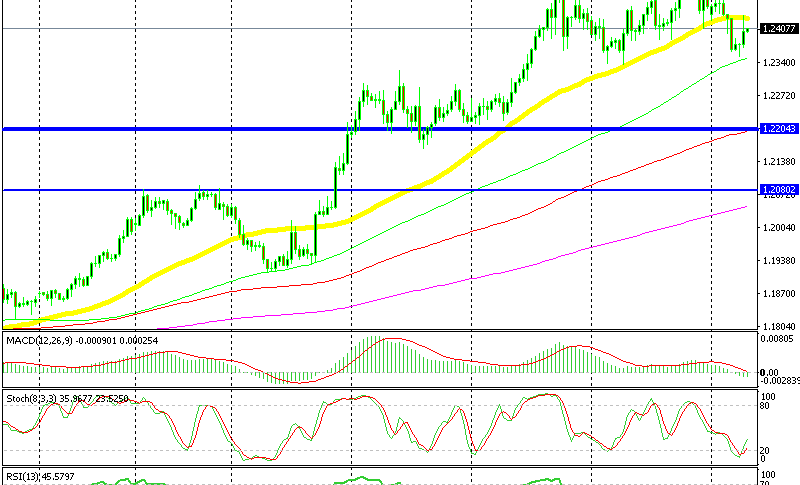
EUR/USD has been trading in a strong uptrend for a long time. The technical indicator which held the uptrend in place in recent weeks, has been the 50 SMA (yellow) on the H4 chart. As you can see from the image below, this moving average has been providing support in the last 6-7 weeks.
There was an occasion when this moving average was broken, but the 100 SMA (green) held its ground. The 100 SMA replaced the 50 SMA. It provided support and the price reversed and EUR/USD resumed the uptrend.

EUR/USD is now stuck between two SMAs; the 50 SMA on top and the 100 SMA at the bottom
Now, a similar scenario is taking place on this forex pair. The price slipped below the 50 SMA yesterday and it reached the 100 SMA today. It bounced more than 80 pips after kissing that moving average, so we can say that the 100 SMA is still standing strong.
But, this time the 50 SMA has turned into resistance it seems. The price pulled back lower after touching the 50 SMA. Actually, this might be a sign that the trend might be changing. Although, we need to break below the 100 SMA (green). If that happens, the buyers won’t be so confident anymore and the trend will be easier to change, but let’s wait.
- Check out our free forex signals
- Follow the top economic events on FX Leaders economic calendar
- Trade better, discover more Forex Trading Strategies
- Open a FREE Trading Account


