Shorting USD/JPY at the Moving Averages
We have been posting quite a few updates about moving averages recently. Well, they work pretty well, so we use them a lot.
Buyers gave up at the 100 SMA
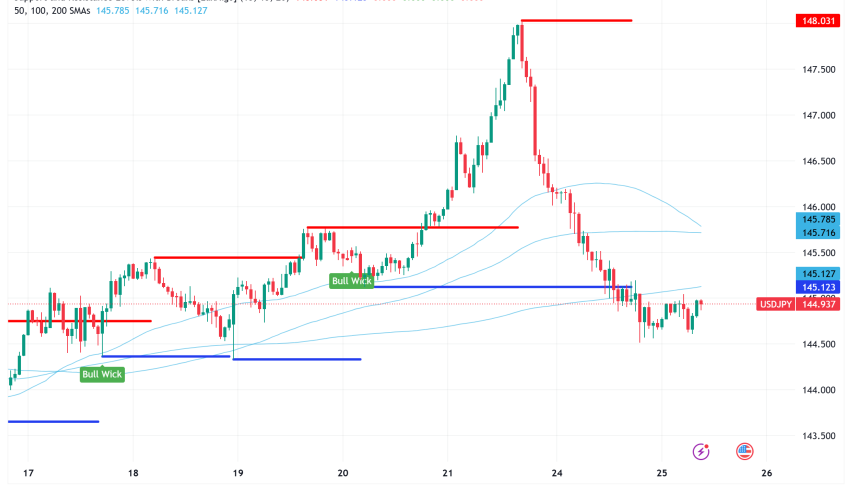
We have been posting quite a few updates about moving averages recently. Well, they work pretty well, so we use them a lot. They are very visible, so many forex traders see and use them, that’s the reason why they work well.We just opened a forex trade based on moving averages in different timeframe charts. We went short on USD/JPY and the moving averages that we used were the 50 SMA on the H4 chart and the 100 SMA on the H1 chart.
As you can see from the hourly USD/JPY chart above, the price retraced higher today after bouncing from that big level at 108.40-50. But, the buyers unloaded their positions and the retrace stopped right at the 100 (green).
The stochastic indicator is overbought on this timeframe chart. You can see that this pair has returned lower every time this indicator has reached overbought levels. We use stochastic as well, although, we explaining moving average now.
The H4 Chart
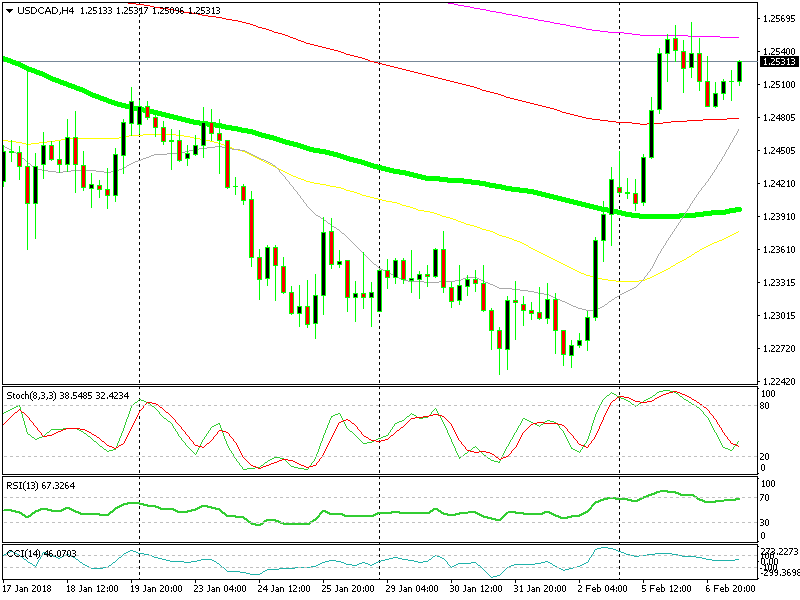
The 50 SMA is doing the job on the H4 chart
If we switch to the H4 chart, we can find the 50 SMA (yellow) right where the 100 SMA was on the H1 chart. This chart is not overbought, but the price reversed right at that moving average. This moving average and the 100 SMA have provided resistance many times before, so they do work. Our forex signal is well in profit now, so this trade looks good.
- Check out our free forex signals
- Follow the top economic events on FX Leaders economic calendar
- Trade better, discover more Forex Trading Strategies
- Open a FREE Trading Account