Interesting Setup for Buyers on the Nikkei Weekly Chart
As I mentioned in the previous forex update, last night I spotted an interesting chart setup in Nikkei. I didn’t touch it because...
As I mentioned in the previous forex update, last night I spotted an interesting chart setup in Nikkei. I didn’t touch it because my colleague Arslan takes care of indices, but I will give him a shout right after posting this update, so we can make some pips in Nikkei as well this wk.
I was looking at the daily charts for major indices and saw that they had been in a horrible downtrend in the last 7-8 days. I scrolled the chart back to see the history and aw that this was one of the deepest pullbacks in about two years.
According to the chart history, this was a pretty decent retrace lower, which brought up the obvious question – Should we ho long on Nikkei? We took a beating back in November. So this looks like a good opportunity to claim back those pips from Nikkei.
The Weekly Chart Setup
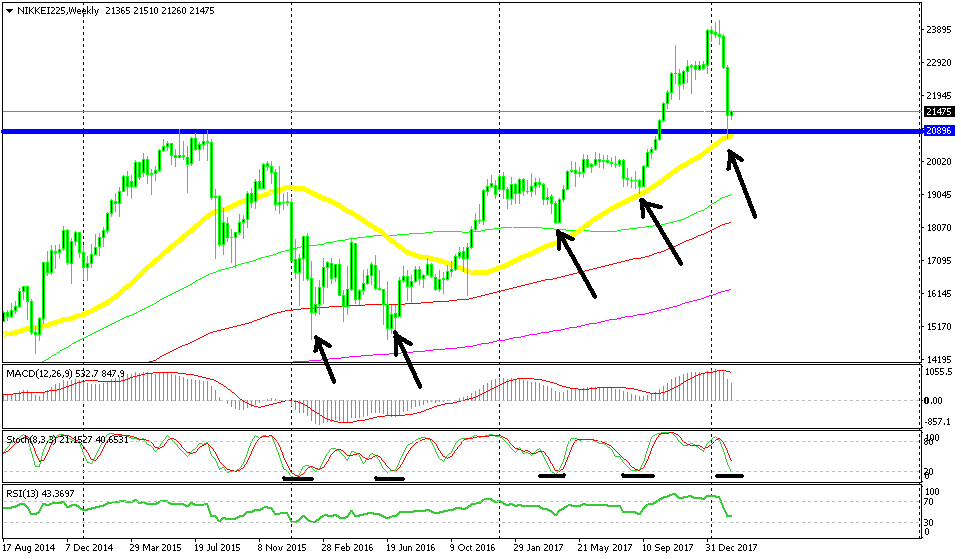
How many technical indicators can you spot on this chart that look bullish to you?
So, I switched to the weekly chart and the picture became clearer. The stochastic indicator just reached the bottom of the window, so the weekly chart just became oversold. You see that every time the stochastic indicator became oversold, the buyers jumped in and took the price higher, extending the uptrend.
This looks like one of those times. Stochastic just became oversold and it looks like Nikkei is turning higher now.
This chart pattern has worked best when moving averages were involved too. Moving averages are good support and resistance indicators. Therefore, the buyers become more confident when they have a moving average covering their backs.
Last Friday, Nikkei closed just above the 50 SMA (yellow) which has acted as support previously. Last night though, most indices opened with a gap higher. So we can say that Nikkei bounced from the 50 SMA.
Besides the 50 SMA providing support and being oversold we have another indicator which is pointing up. The area around $21,000 has provided support back in 2015. The buyers pushed above it last year and now, it has turned into support.
I think we have enough indicators telling us to go long on this index. I will give Arslan a shout now and tell him to get ready to open a long term buy signal in Nikkei.
- Check out our free forex signals
- Follow the top economic events on FX Leaders economic calendar
- Trade better, discover more Forex Trading Strategies
- Open a FREE Trading Account