H4 Technical Indicators Work Well on USD/CAD
If you remember, we talked about USD/CAD yesterday. After trending strongly up during February so far, in the last several days, this...
If you remember, we talked about USD/CAD yesterday. After trending strongly up during February so far, in the last several days, this forex pair has traded in a range between 1.2560 and 1.2630.
Yesterday, the sellers were having trouble pushing below 1.2570, so we opened a buy forex signal at 1.2580. That signal closed in profit during the afternoon as buyers had another attempt to the upside.
They failed to break the resistance, but we got our pips, so it doesn’t really matter much for us. What matters for us is that the support stays strong, since we opened another buy signal at the same level as yesterday.
Last evening, USD/CAD was pulling back down, but I was following the price action and the sellers were having trouble again pushing below 1.2580. So, I decided to place a buy pending order at 1.2580.
This morning, I woke up to see this forex pair below that level. The sellers had finally pushed below it. The price had reached 1.2560 and it was reversing back up. That was a good sign; the support at 1.2560 had resistance once again.
The 200 SMA
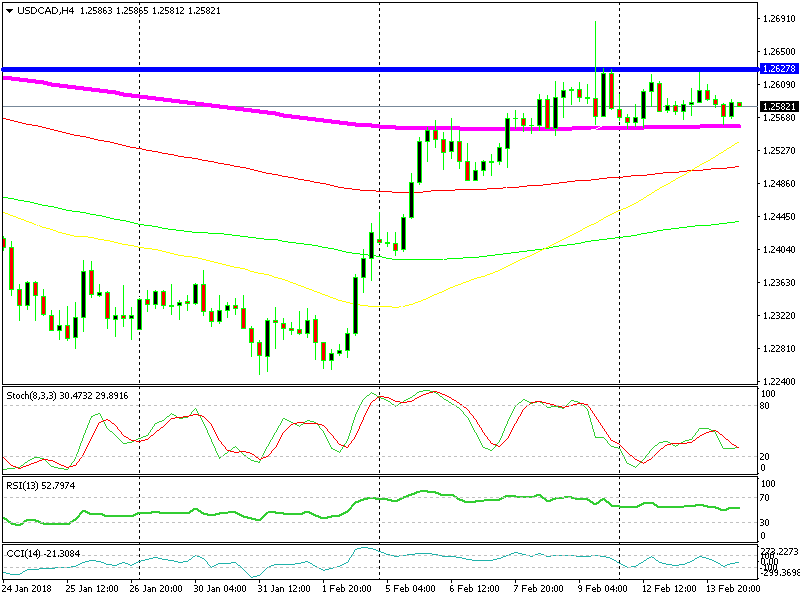
This moving average is doing the job well
Although, more than the support level itself, we were counting on the 200 SMA on the H4 chart. This is the technical indicator I have been looking at for support. As you can see, it has been a solid support indicator and it did the same today as well. Now, this pair is heading up again so this signal looks good. By the way, our GBP/USD signal just hit take profit.
- Check out our free forex signals
- Follow the top economic events on FX Leaders economic calendar
- Trade better, discover more Forex Trading Strategies
- Open a FREE Trading Account