EUR/USD Determining the 20 Daily SMA
The EUR/USD suddenly turned bearish in the last few days. It made new records on Friday morning when it broke January’s highs at 1.2530s.
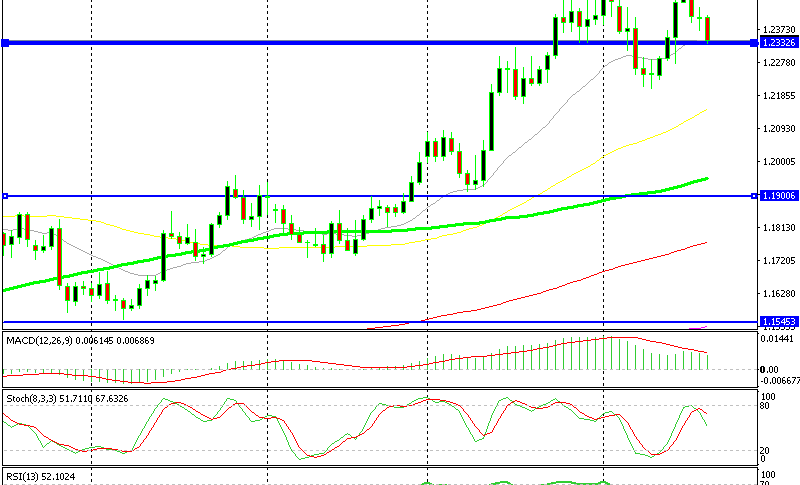
The EUR/USD suddenly turned bearish in the last few days. It made new records on Friday morning when it broke January’s highs at 1.2530s, reaching 1.2550s that day as the US Dollar went into a freefall.
Eventually, it reversed down and continued falling pretty quickly, losing more than 200 PIPs.
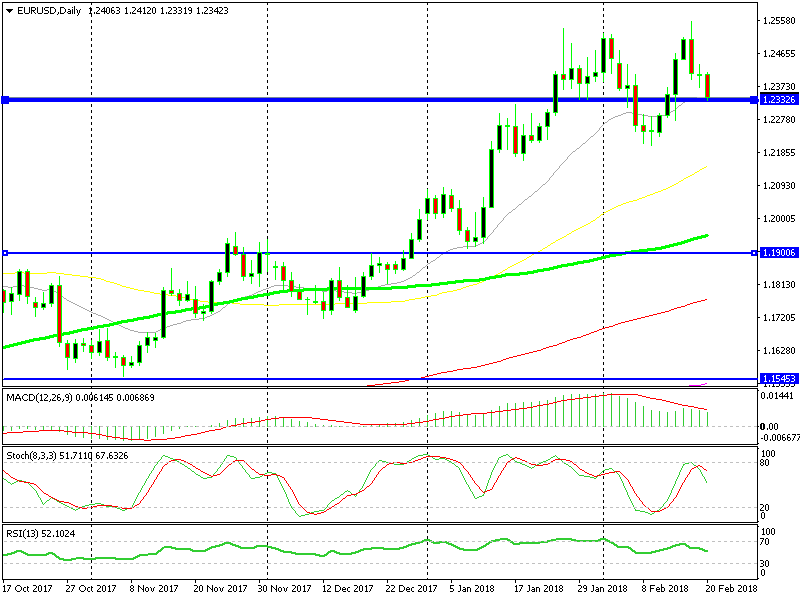
The 20 SMA is providing support on the daily chart
The EUR/USD is now trading at 1.2330s and supplying support. Until this area was broken in January, it proved to be resistant.
The biggest obstacle we have here is the 20 SMA (grey). This moving average is standing at 1.2340, which is within the range of 1.2320s to 1.2340s, our beloved support area. It keeps the uptrend going for this pair.
Forex traders are having difficulties breaking below the trend today. Judging by the price action these past few days, I have a feeling this support area will last and if it does, then this month’s low comes into play at 1.22. Let’s see if this support area will let go first.
- Check out our free forex signals
- Follow the top economic events on FX Leaders economic calendar
- Trade better, discover more Forex Trading Strategies
- Open a FREE Trading Account