USD/CAD Reverses at Resistance Level
The USD/CAD have been behaving strangely lately. The pair reversed downward at 200 SMA on the daily chart in mid-December and lost 650 pips
The USD/CAD have been behaving strangely lately. The pair reversed downward at 200 SMA on the daily chart in mid-December and lost about 650 PIPs to the end of January.
This month, USD/CAD has been climbing higher, peaked last Wednesday and then tumbled about 200 PIPs lower as the USD fell through an air pocket.
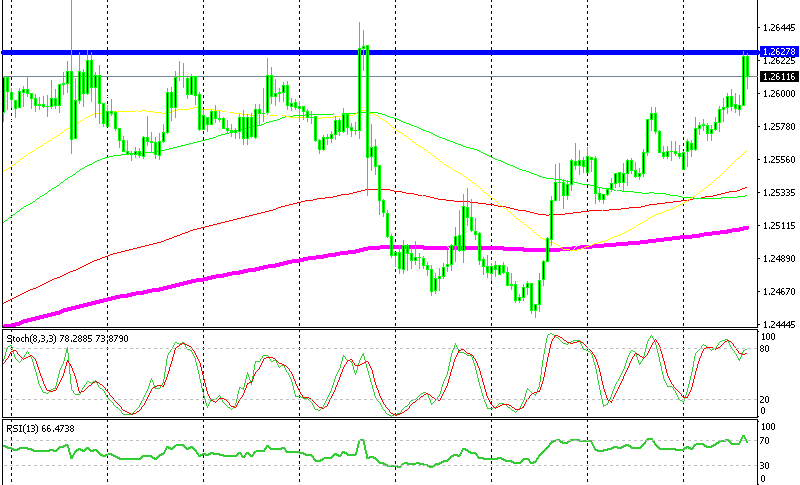
A resistance level has been established at 1.2620-30
It did reverse higher again however as the Buck recuperated and it has climbed around 200 PIPs. Currently, it faces an obstacle on the top side.
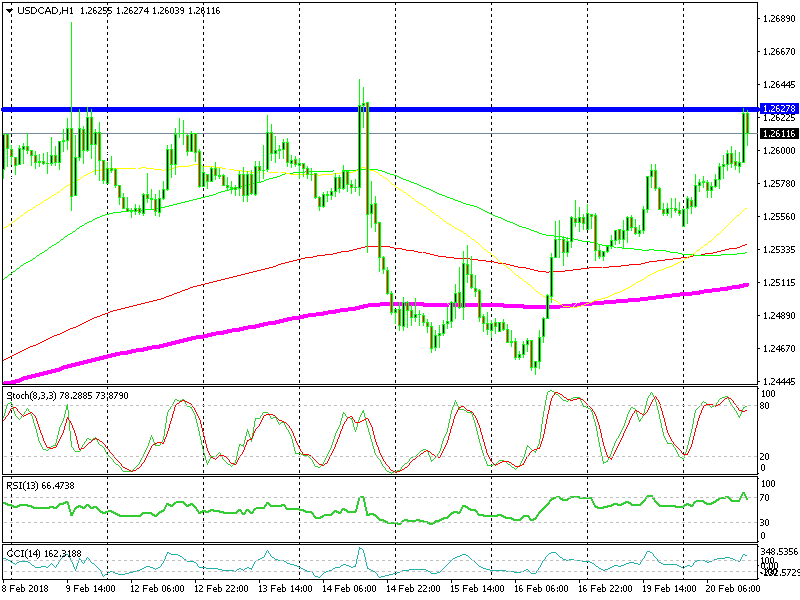
As you can see from the hourly chart, this forex pair has formed a resistance area, coming between 1.2620 and 1.2630. The buyers pushed 40 PIPs higher in the previous hour, reaching the resistance level.
Once they reached that level, the buyers stopped. The price is now retracing lower as quickly as it did when it bounced higher. This resistance level is clearly working.
Will the price make a proper reverse and end up 200 PIPs lower? It’s not known, but the price action is indicating that there is strong selling pressure at that resistance level. If the price reaches that level again, there is a possibility a sell forex signal can be opened.
- Check out our free forex signals
- Follow the top economic events on FX Leaders economic calendar
- Trade better, discover more Forex Trading Strategies
- Open a FREE Trading Account
- Read our latest reviews on: Avatrade, Exness, HFM and XM
Related Articles


Sidebar rates
Related Posts
