USD/JPY Purchase Ready at 100 SMA
The trend in the USD/JPY seems to have changed. Until last Friday, it was falling without any bounce back. Now, it climbs without any...

The trend in the USD/JPY seems to have changed. Until last Friday, it was falling without any bounce back. Now, it climbs without any challenge from the sellers whatsoever.
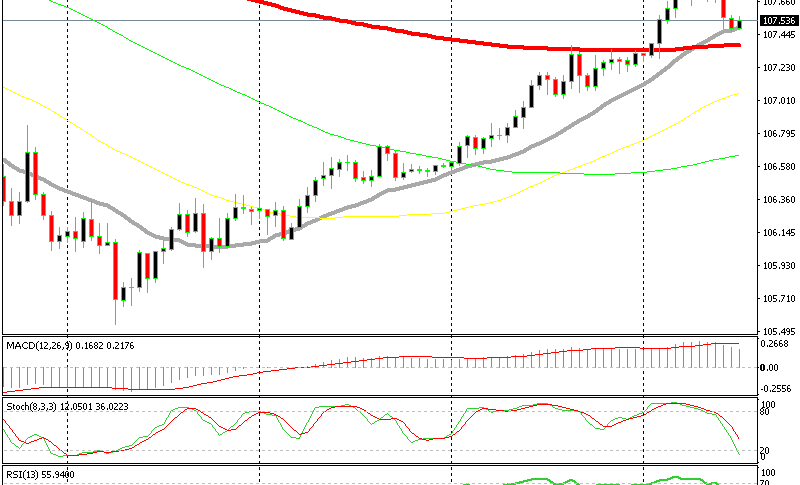
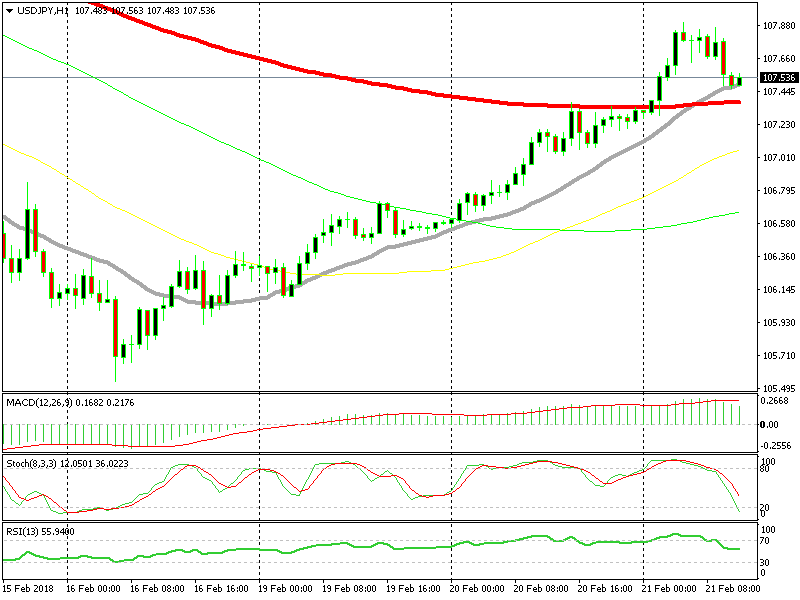
This morning the USD/JPY reached 107.80, which is about 230 PIPs higher than the lows. Looking at the hourly chart below, pullbacks during these last several days have been minimal. The deepest pullback happened last Friday when the reverse was taking place.

Just went long at the 20 SMA
The dip was around 40 PIPs, which is small considering the progress we are seeing in this pair and in other major forex pairs nowadays. This is exactly the sort of price action that suggests a trend reversal.
A change in strategy is needed since we were caught on the wrong side of the sell signals this time. We are thinking of going long on this forex pair and buying around the current levels as we are pretty close to the 100 smooth MA (red). That moving average presented resistance for a while yesterday. Last night it ended up breaking and the price is trading just 20 PIPs above it.
Switching to the H4 chart, here we see the 50 SMA standing in the same area at 107.30s, which happens to be a great place to go long from. The 20 SMA (grey) on the H1 chart, however, is currently doing the job of providing support so USD/JPY might not even reach the 100 SMA (red).
- Check out our free forex signals
- Follow the top economic events on FX Leaders economic calendar
- Trade better, discover more Forex Trading Strategies
- Open a FREE Trading Account


