AUD/USD Backs Off the 200 SMA with Plenty of Room to Fall
AUD/USD has been trading in a slight uptrend in the last two and a half years. I haven't noticed it but that's the case here.
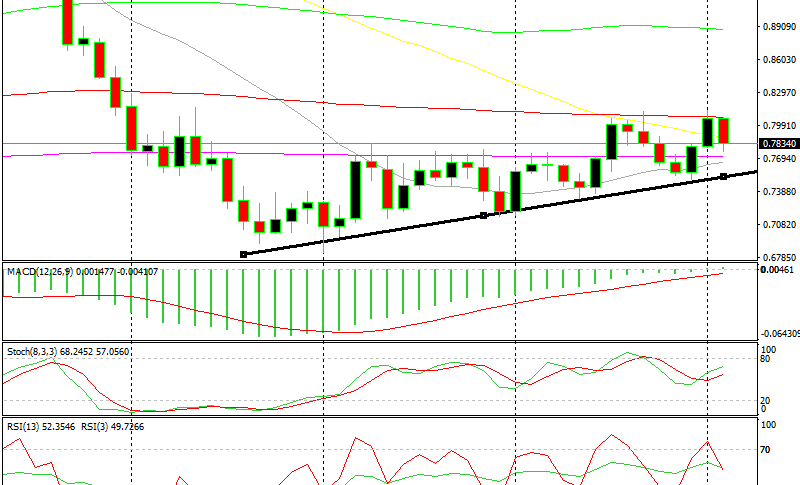
AUD/USD has been trading in a slight uptrend in the last two and a half years. I haven’t noticed it but that’s the case here. This uptrend has evolved in upward waves, followed by corrections down.
As you can see from the monthly chart below, this pair has been trading on an upward move in the last two months. It has climbed from 0.75 to above 0.81 which means a 600 pip climb.
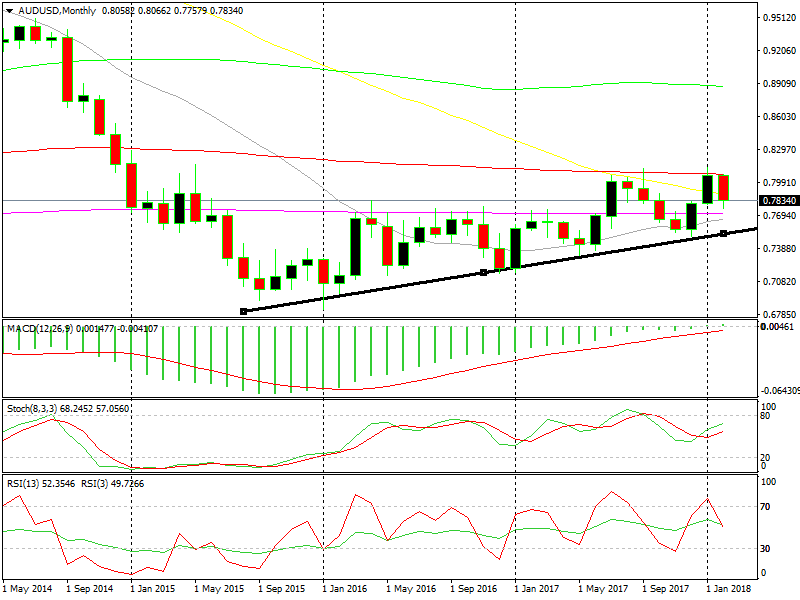
An uptrend has formed in the last two and a half years
But, it ran into the 100 SMA (red) and it looks like the buyers are scared of this moving average. The price has reversed back and is about 300 pips lower now. So, this moving average has provided resistance. It did the same thing back in September last year and AUD/USD fell about 600 pips from top to bottom.
Now, the potential is about the same. The distance between that moving average and the ascending trend line is about 600 pips. We have covered half the way down and there’s the other half to be covered, if this pattern is to work out as it has in the two and a half years.
We are short on this pair from 0.7940s, so we are about 100 pips in profit already. If we hold the trade, the target is 400 pips. You can now place you stop loss at break even to avoid any more pain.
- Check out our free forex signals
- Follow the top economic events on FX Leaders economic calendar
- Trade better, discover more Forex Trading Strategies
- Open a FREE Trading Account
