Technical and Fundamental Analysis Fall in Line for USD/CAD
I was looking at daily USD/CAD chart and I spotted a bearish pattern. So, we were thinking of shorting this forex pair.
I was looking at daily USD/CAD chart and I spotted a bearish pattern. So, we were thinking of shorting this forex pair. But, the Canadian inflation report was about to be released soon, so I held back. Now that the report is released, this pair has dived, so both analyses went hand in hand.
That happens pretty often in forex if you haven’t noticed. Right when a pair reaches a big level or a major indicator and it has to make a decision, the fundamentals kick in and make that decision for the pair.
The Technical Analysis
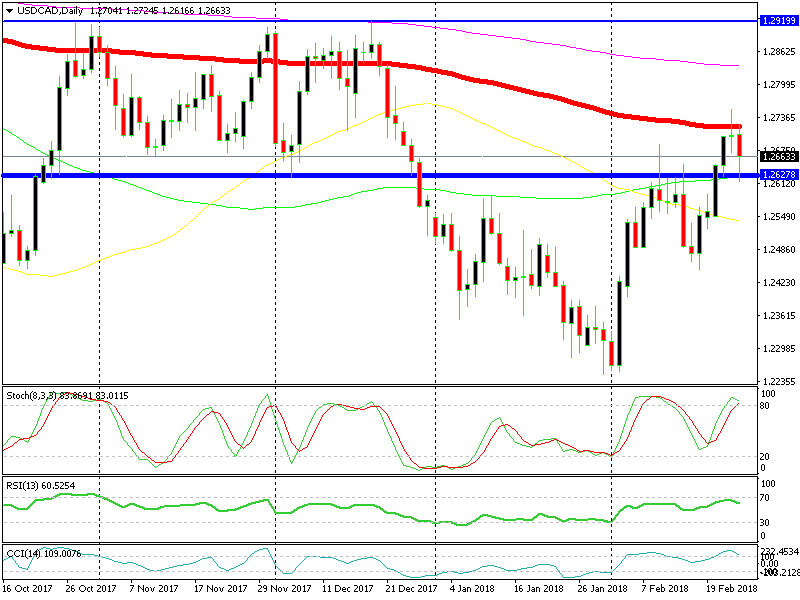
As you can see from the daily chart below, USD/CAD has been trading in an uptrend during this month. It has gained about 500 pips during this time, but yesterday it ran into the 100 SMA (red).
The 200 SMA has been the one to provide resistance in the previous months, but this time the 100 SMA is doing that job. It stopped the climb yesterday and now we are turning lower.
The stochastic indicator is overbought, which also points down. Although, yesterday’s candlestick is one of the strongest bearish signals, technically. It formed a doji which is a reversing signal, especially when the price is overbought.

The 100 SMA provided solid resistance yesterday
The Fundamental Analysis
The Canadian consumer inflation report CPI (consumer price index) was published a while ago and it was mainly positive. Expectations for the monthly number was at 0.4% and the actual number came at 0.7%. That’s a great number considering that last month inflation declined by 0.4%.
The yearly CPI number came out higher as well. Expectations were for a 1.5% reading, while the inflation for the year-to-date came at 1.7%.
We missed the chance to get it short on USD/CAD, but it has retraced back up now after losing about 100 pips after the release as the USD finds some bids. This looks like a good opportunity to go short now, but the quick retrace up has got me worried that sellers might have closed all their trades, so we’re not live on this pair yet.
- Check out our free forex signals
- Follow the top economic events on FX Leaders economic calendar
- Trade better, discover more Forex Trading Strategies
- Open a FREE Trading Account


