100 SMA Blocking EUR/USD
The US Dollar made a swift reversal today wouldn't you say? The USD/JPY lost 80 PIPs this morning but then reversed around midday and...
The US Dollar made a swift reversal today wouldn’t you say? The USD/JPY lost 80 PIPs this morning but then reversed around midday and flirting with level 107. It hovered above and below several times in the last several hours.
On the hourly chart, we have stopped the loss for our sell signal above the two 100 SMAs. Hopefully, these moving averages will scare away buyers and encourage sellers.

EUR/USD will turn bearish when the 100 SMA (red) brakes
The Moving Average
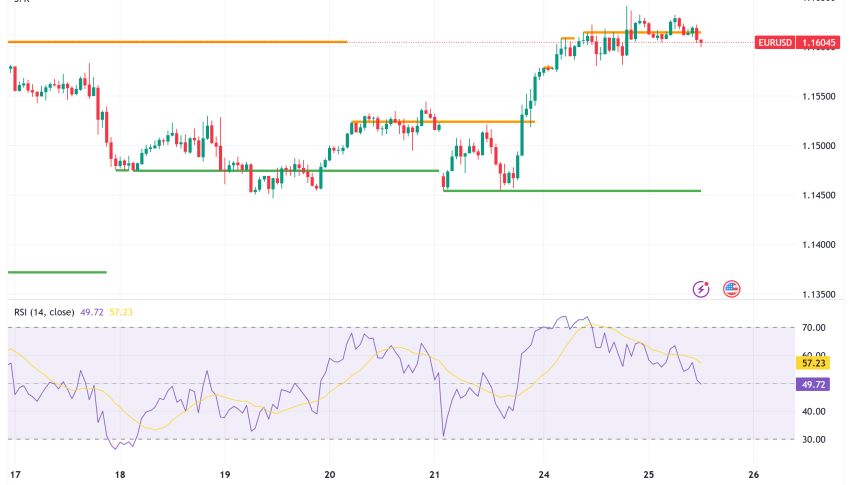
The EUR/USD climbed above 1.2350 and trading at 1.23 yet the 100 SMAs on the H1 and H4 charts reversed the price. As you can see from the EUR/USD chart below, during February, this moving average has been tough. It has provided support many times and currently doing the same.
The Candlestick
The previous H4 candlestick is a bullish indicator as well and closed as a Doji after a downtrend. I use candlesticks as one of the main tools to indicate a reversal after a retrace.
The Stochastic
The stochastic is a good technical indicator to show overbought and oversold levels. It is currently heading down and has some room to continue until it reaches the oversold area that contradicts the bullish signals.
The Price Action
Another bearish indicator is the price action today. The bulls seemed to be in control at first, but the reverse was quick and sellers didn’t receive much resistance from buyers, showing there is pressure on the downside for the EUR/USD.
- Check out our free forex signals
- Follow the top economic events on FX Leaders economic calendar
- Trade better, discover more Forex Trading Strategies
- Open a FREE Trading Account


