EUR/USD in Difficult Locale on Major Timeframe Charts
I was looking at the weekly and monthly charts of the EUR/USD last night. This forex pair has covered quite some distance, showing signs...
I was looking at the weekly and monthly charts of the EUR/USD last night. This forex pair has covered quite some distance, showing signs of exhaustion as it struggled to hold on above 1.25.
The Weekly Chart
Looking at the weekly chart below, we can see that the EUR/USD is having difficulties pushing higher. It made two bearish candlesticks after making two bullish ones confirming that sellers are pushing lower with equal force as the buyers.
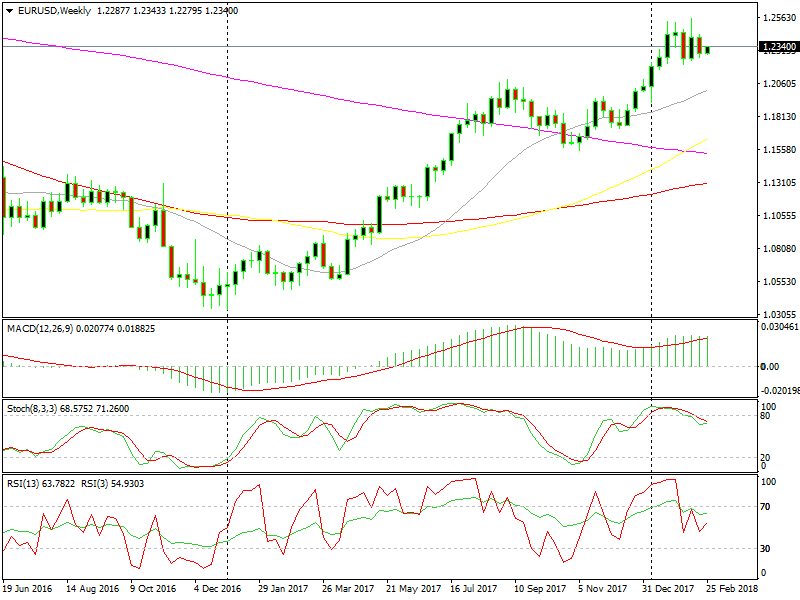
These last several candles are showing signs of weakness from the buyer
Last year, this pair didn’t wait around before making its next move up, apart from one occasion in the Fall when we saw a retrace lower. The EUR/USD is not pushing back lower or moving higher, indicating buyers are tired.
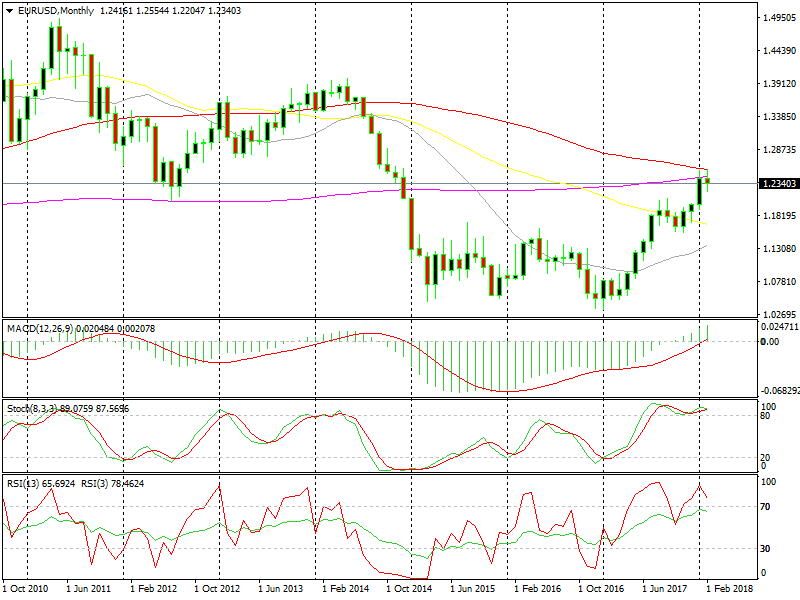
The Monthly Chart
 EUR/USD teaming up
This monthly chart seems rather bullish, especially January’s candlestick. Thus buyers have run into two moving averages: the 100 SMA (red), which adds more strength to the 1.25 area, and the 200 SMA (purple), the long-term support provider – one being in 2009 after the global financial crisis, and the next in 2012 at the height of the Greek debt crisis.
The 200 SMA broke about three years ago and it looks like now it’s providing resistance, showing signs of a possible reversal or a decent pullback. President Trump is no longer lowering the Dollar anymore so the fundamental analyses are falling in line with the technical analyses for the EUR/USD sellers.
- Check out our free forex signals
- Follow the top economic events on FX Leaders economic calendar
- Trade better, discover more Forex Trading Strategies
- Open a FREE Trading Account