Buying USD/JPY at 50 SMA
Here is another live forex signal from today - we went long on the USD/JPY as this pair retraced lower and reached the 100 SMA on the H1...
Here is another live forex signal from today – we went long on the USD/JPY as this pair retraced lower and reached the 100 SMA on the H1 chart. We based our trade however on the H4 chart, so let’s see how this timeframe chart looks.
The USD/JPY is not making new lows it is actually making higher lows, which is a sign that the downtrend has come to an end.
Besides for that, the stochastic indicator, a great indicator for showing the end of a retrace, is almost oversold on the H4 chart. In this case, the retrace is almost over since stochastic is nearly oversold.
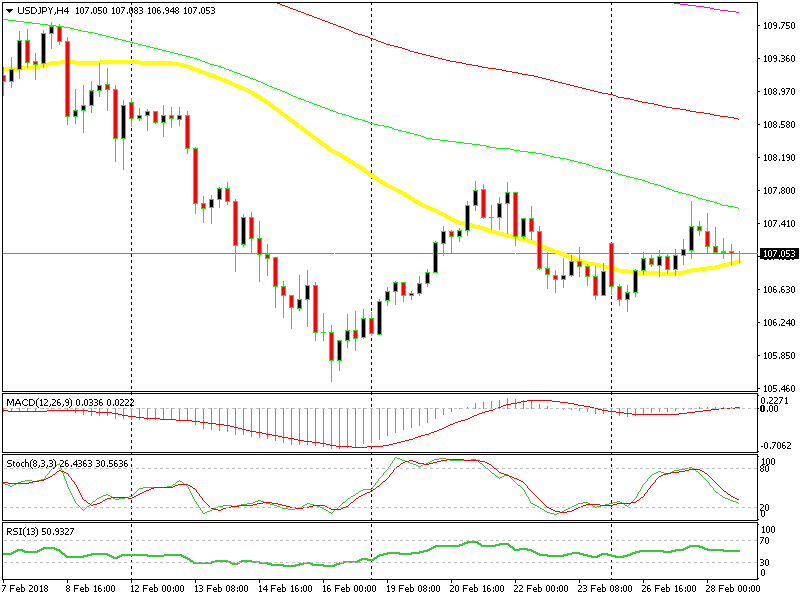
50 SMA stopping sellers at 107
The strongest indicator is the 50 SMA (yellow). This moving average acted as support back in January and now acting as a resistance. We thought going long with this moving average would be a safe trade as it’s been containing sellers all day today.
The previous H4 candlestick formed a Doji, working more or less like the stochastic. It indicates when a forex pair is about to reverse, which the USD/JPY looks like it will do. We took that trade based on this chart setup. Let’s give it time.
- Check out our free forex signals
- Follow the top economic events on FX Leaders economic calendar
- Trade better, discover more Forex Trading Strategies
- Open a FREE Trading Account
- Read our latest reviews on: Avatrade, Exness, HFM and XM
Related Articles

Sidebar rates
Related Posts
