Selling NZD/USD at 50 SMA
In the midday brief that we posted earlier, we talked about opening a forex sell signal with the AUD/USD. The downtrend in this pair has...
In the midday brief that we posted earlier, we talked about opening a forex sell signal with the AUD/USD. The downtrend in this pair has accelerated and is going through a retracement period. Since the stochastic reached overbought levels while the 20 SMA provided support on the hourly chart, it all seems complete.
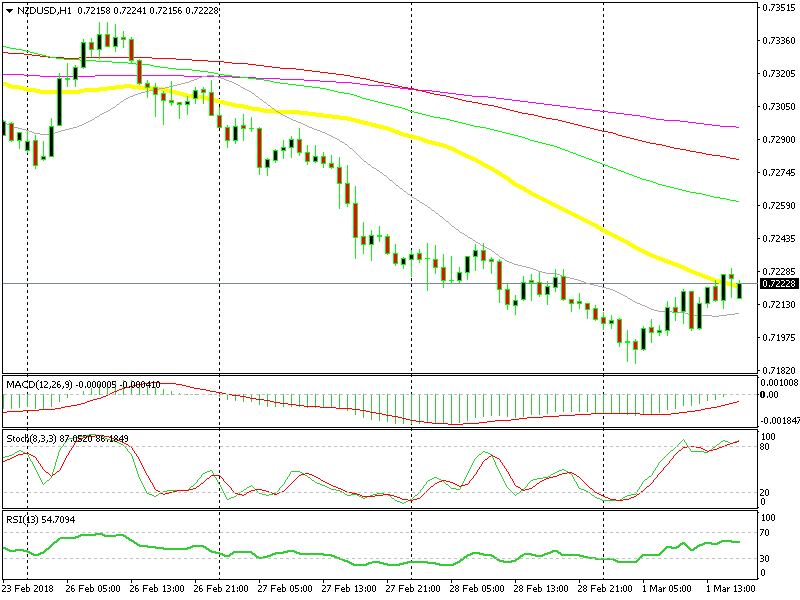
The same situation is going on with the NZD/USD. Commodity currencies move as a group and the chart setup looks similar thus we decided to go short on this forex pair.
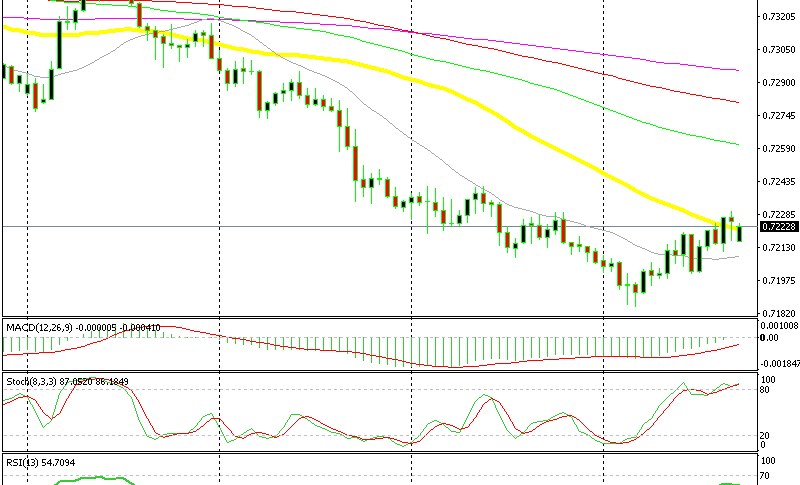
As you can see from the NZD/USD chart below, the stochastic indicator became severely overbought several hours earlier and is hitting its head on the tip of the range.
50 SMA stopping the climb
While the 20 SMA (grey) is providing resistance on the AUD/USD, here the 50 SMA (yellow) is doing so and becoming a stronger technical indicator, to be honest. The bigger the moving average, the better it works.
We opened a forex sell signal with the NZD/USD and this trade is looking just fine. There was a small spike up, but the price returned below the 50 SMA again. The Euro and the AUD/USD are reversing lower, while the NZD/USD is stuck. Hopefully, this pair will make a move lower and join the rest.
- Check out our free forex signals
- Follow the top economic events on FX Leaders economic calendar
- Trade better, discover more Forex Trading Strategies
- Open a FREE Trading Account