USD/CAD & AUD/USD In Trouble – Harmonic Patterns Offering Swing Trades
While doing the analysis, I spotted a Cypher pattern called "Bearish White Swan". Typically, this pattern weakens the bullish trend...
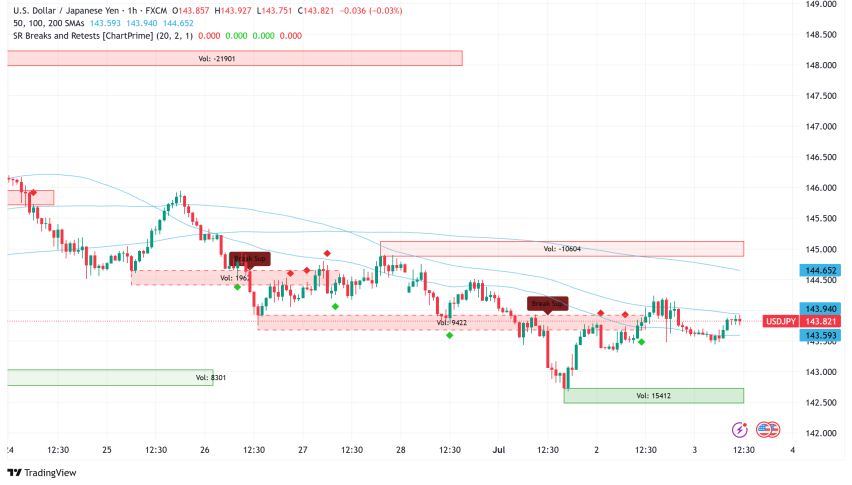
The commodity currencies, the Aussie and the Loonie are losing grounds against the US dollar for two reasons. First, the strengthening of the US dollar. The second is the price of commodities. As we know, both the Australian and the Canadian economies are highly dependent on the export of Gold and Crude Oil.
Thus, a drop in the commodity prices hit them hard yet it’s time to catch a reversal. Up for swing trades?
USD/CAD – Bearish Black Swan
The Loonie continued to trade its bullish momentum to reach a solid resistance zone of $1.2900. While doing the analysis, I spotted a Cypher pattern called “Bearish White Swan”. Typically, this pattern weakens the bullish trend and drives bears into the market.
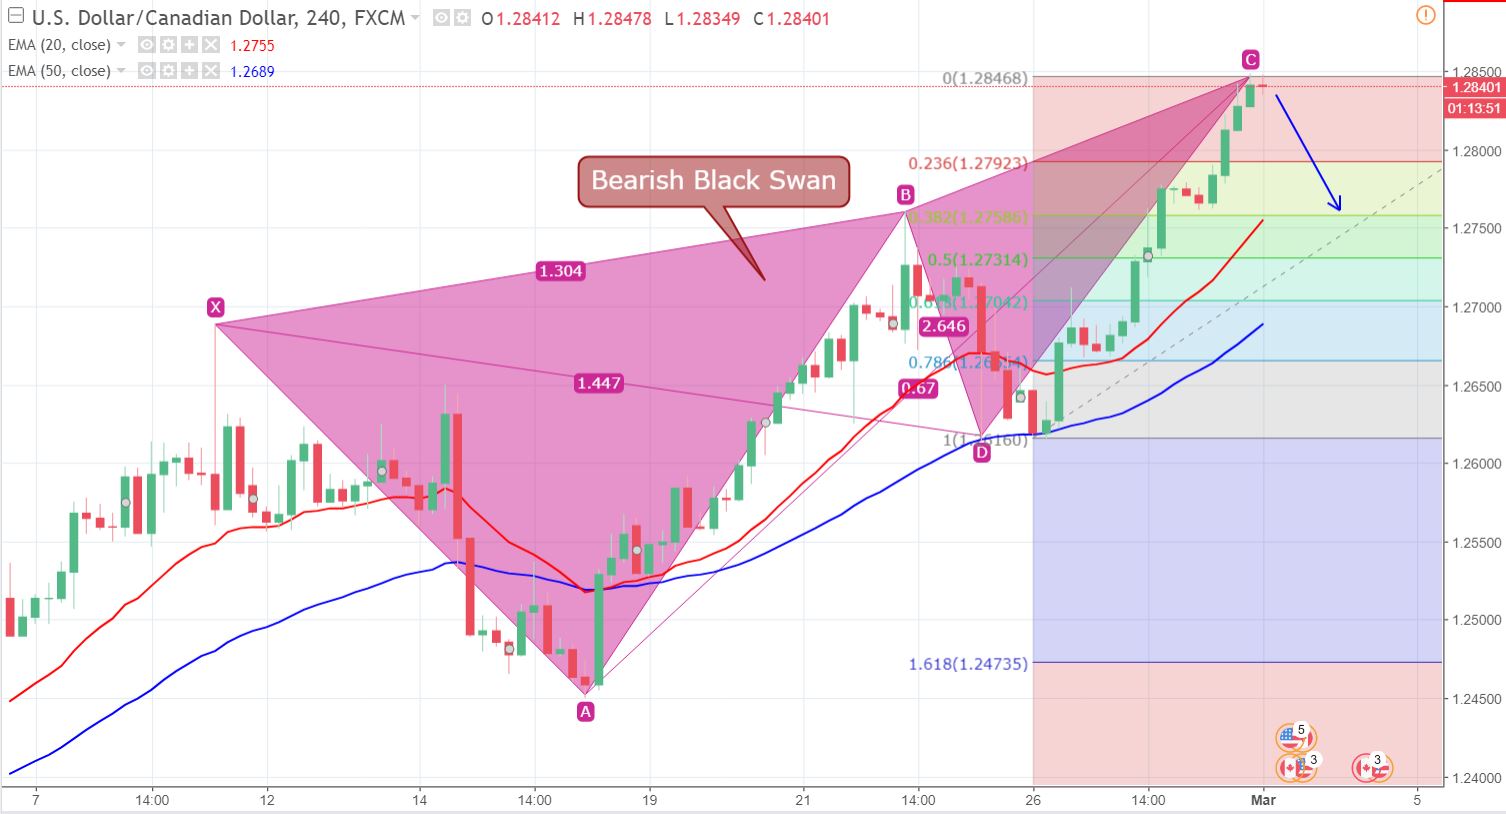
USD/CAD – 240 Min Chart
You can see on the 4-Hour Chart that the pattern just completed it’s 2.64% extension near $1.2850. Besides for this, the RSI and Stochastics are massively overbought above 80. Both of these technical indicators are signaling a potential of reversal in the pair.
USD/CAD – Key Trading Levels
Support Resistance
1.2782 1.2844
1.2764 1.2862
1.2733 1.2893
Key Trading Level: 1.2813
USD/CAD – Trading Plan
Despite the bearish setups, I would like to wait for the market to go below $1.2900 before taking sell position. The stop needs to be near $1.29350 along with a profit of $1.2810 and $1.2775.
AUD/USD – Max Gartley
I spotted another pattern on the 4-Hour chart for the AUD/USD. It’s Max Gartley, which is about to complete near $0.7720. I hope it completes as it will be a nice opportunity for us to capture 75 to 100 PIPs trade.
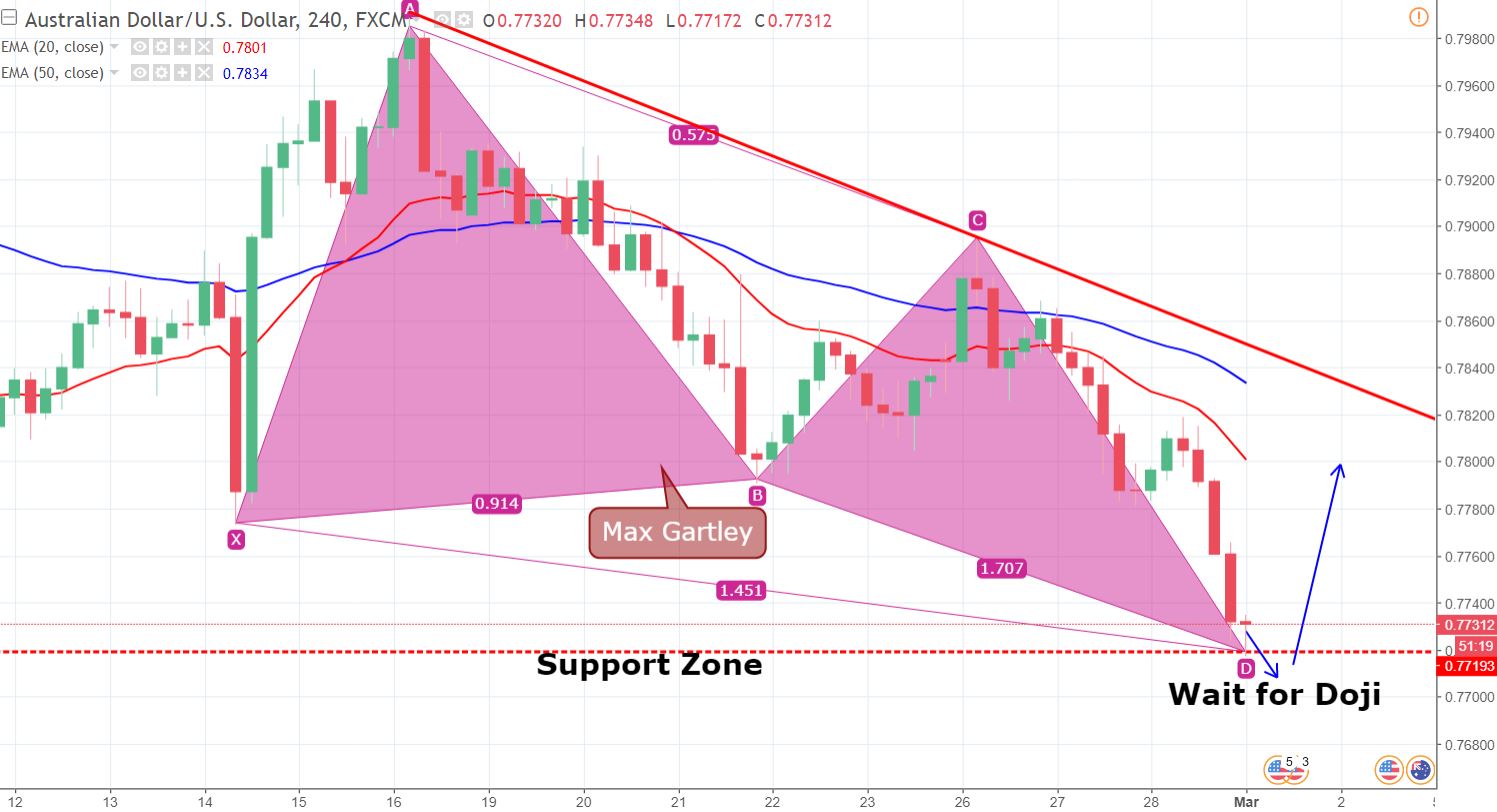
AUD/USD – 240 Min Chart
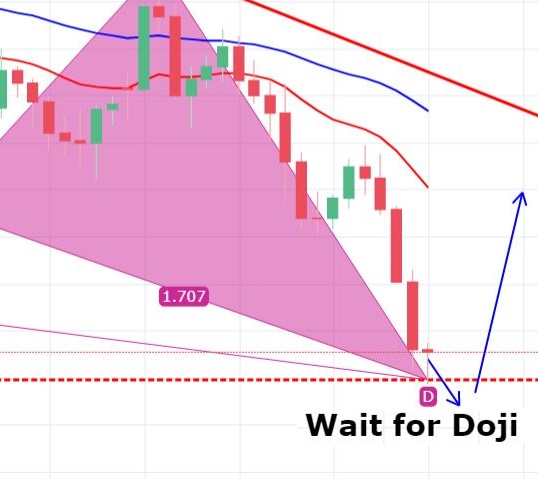
The Aussie is facing an immediate support at 0.7719 and is expected to form a Doji or a Hammer candle right above this level. A candlestick hammer pattern followed by a strong bearish trend is a good indication of bullish reversals.
AUD/USD – Key Trading Levels
Support Resistance
0.7755 0.7803
0.774 0.7818
0.7716 0.7842
Key Trading Level: 0.7779
AUD/USD – Trading Plan
I will be looking to take a buy position above 0.7720 if the Aussie manages to close a hammer candle. The stop should be below 0.7695 along with a profit of $0.7775. Refer to FX Leader Candlestick Trading Strategyfor a clearer understanding of these candles.
- Check out our free forex signals
- Follow the top economic events on FX Leaders economic calendar
- Trade better, discover more Forex Trading Strategies
- Open a FREE Trading Account