USD/JPY Preparing for Movement Downward
We opened a forex signal yesterday with the USD/JPY. When we took that trade, this pair has been on a downtrend for some time...
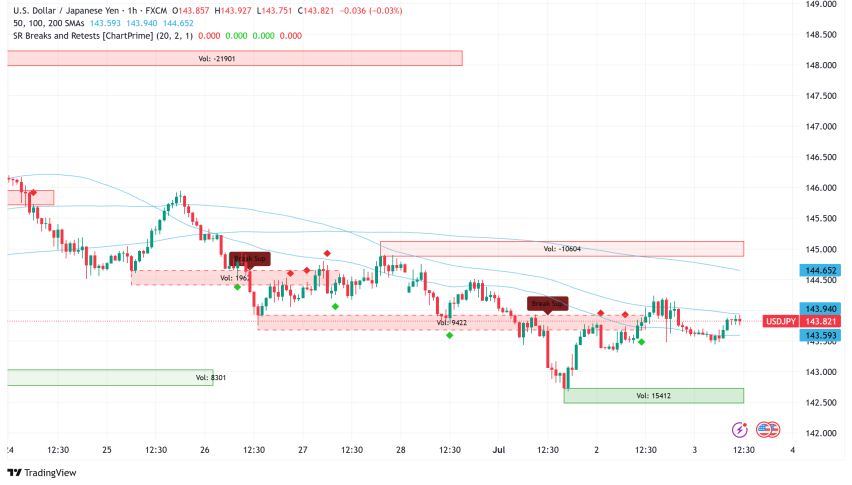
We opened a forex signal yesterday with the USD/JPY. When we took that trade, this pair has been on a downtrend for some time and completed a retrace higher on the H1 chart. The 50 SMA (yellow) was providing resistance and the stochastic indicator was overbought.
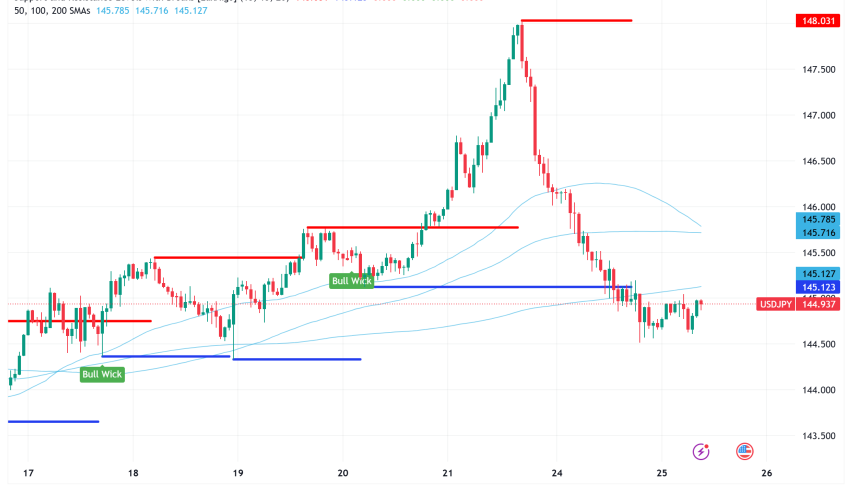
The USD/JPY traders were trading the higher timeframe charts thus the setup on the H1 chart didn’t matter. The pair continued higher and our signal hit SL in the afternoon. Traders are looking at the chart below and respecting the indicators, technical indicators work well when numerous traders look at them.
H4 chart working today for USD/JPY traders
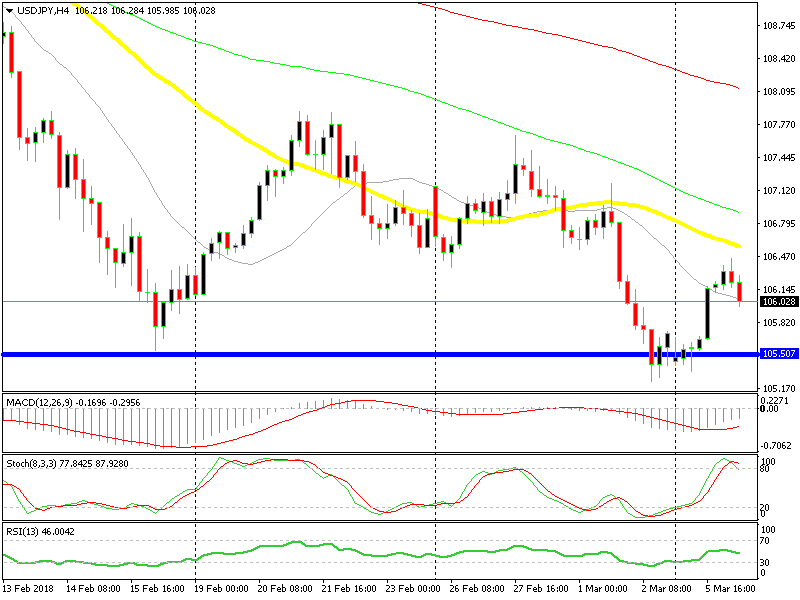
The chart setup on the H4 timeframe looks bearish. The price got close to the 50 SMA and returned lower from there. The H4 candlestick formed a small upside down hammer, usually after an uptrend or after a retrace higher.
I would have gone short, but the pair is about 50 PIPs lower from the top so I’m waiting for another pullback higher. If the price gets close to the 50 SMA again, then perhaps I will go short on this pair.
- Check out our free forex signals
- Follow the top economic events on FX Leaders economic calendar
- Trade better, discover more Forex Trading Strategies
- Open a FREE Trading Account