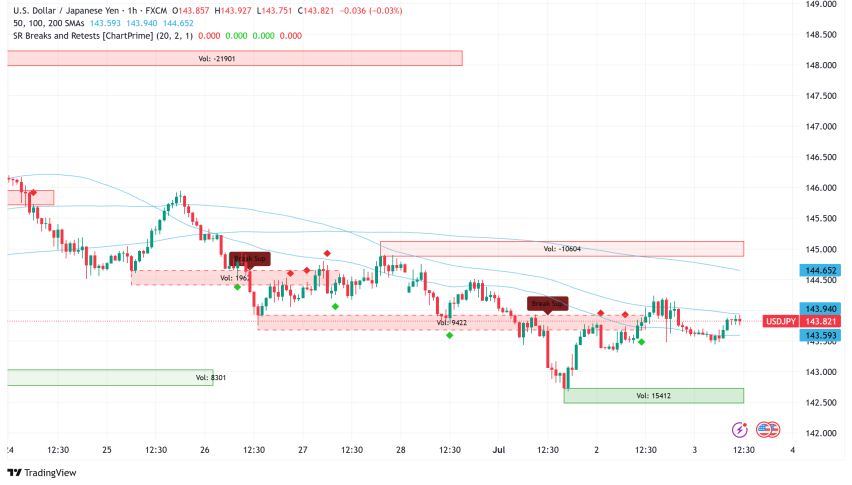
USD/JPY Trade at Moving Average
In the previous forex update, we posted our NZD/USD trade explaining how we used the 100 SMA on the H1 chart to decide whether to go short..

Update: This article got held up somewhere in the system and the USD/JPY signal now reached the stop loss target. The reasoning behind this trade is how we ordinarily choose trades, which has delivered good results in the long term.
In the previous forex update, we posted our NZD/USD trade explaining how we used the 100 SMA on the H1 chart to decide whether to go short on this pair. We use moving averages because they are quite visible and many forex traders use them. The more traders use a technical indicator, the better it works.
We spotted an additional moving average providing resistance on a major pair. Therefore we decided to take another trade based that additional moving average. This pair is the USD/JPY.
100 SMA providing resistance for the USD/JPY
From the H1 chart above, buyers have pushed higher in the last several hours, from 105.30s. They took the price to the 50 SMA (yellow) but stopped there. This looks like a classic resistance play from the 50 SMA.
We didn’t open a forex trade based only on one technical indicator, we know the trend is very important in forex and with this pair, the trend is surprisingly bearish. This latest pullback up is only a retrace of the bigger downtrend.
The stochastic indicator is an excellent way to show us when a pair is overbought and oversold. For example, the USD/JPY is overbought, so the retrace up seems complete. Whether enough sellers are looking at this chart setup is unclear. If yes, this pair should move lower soon.
- Check out our free forex signals
- Follow the top economic events on FX Leaders economic calendar
- Trade better, discover more Forex Trading Strategies
- Open a FREE Trading Account