100 SMA Capping the Moves in EUR/USD
The EUR/USD turned higher in the first week of March and continued higher last week. President Trump’s tweets about taxes and North Korea’s
The EUR/USD turned higher in the first week of March and continued higher last week. President Trump’s tweets about taxes and North Korea’s peace talks hurt the US Dollar and the Euro took advantage of it.
The Dollar gained some momentum at the end of last week and a reverse lower followed on Thursday. The European Central Bank helped the sellers as well; Mario Draghi made some comments that sounded slightly dovish and the EUR/USD ended up about 150 PIPs lower.
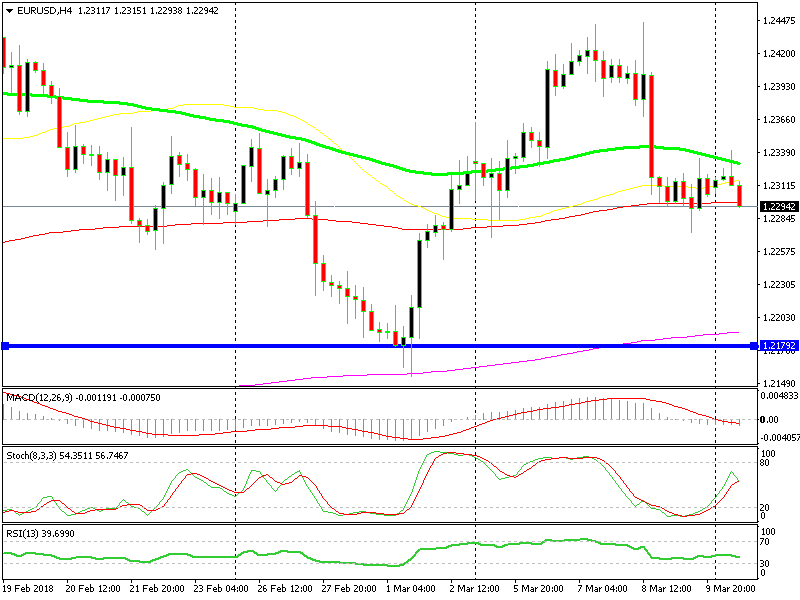
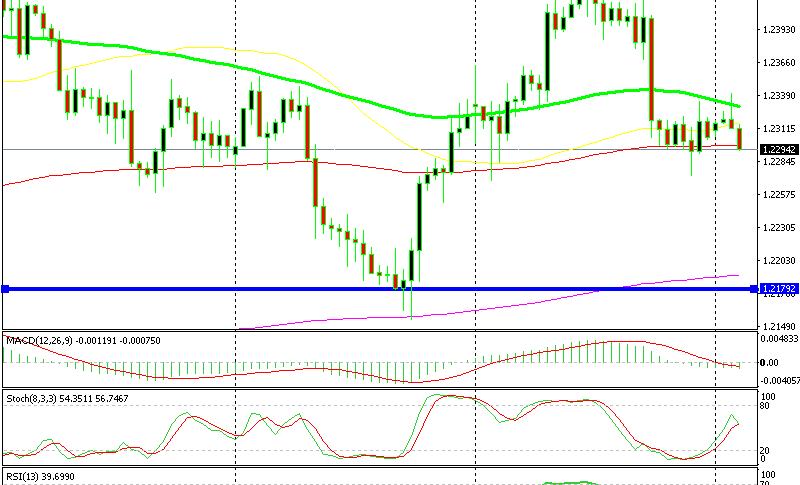
The 100 SMA is providing resistance
The price dipped below the 100 SMA (green) on the H4 chart and stayed below it since then. Buyers have tried a few times to push this forex pair back above this moving average but without much success.
Buyers had another try this morning but couldn’t break the 100 SMA. The previous H4 candlestick closed as an upside-down hammer, a reversing signal. The current H4 candlestick looks bearish thus the picture is continuing to turn bearish for the EUR/USD. There’s an additional chart setup on the Daily timeframe which we will have a better look at on the next forex update.
- Check out our free forex signals
- Follow the top economic events on FX Leaders economic calendar
- Trade better, discover more Forex Trading Strategies
- Open a FREE Trading Account


