Forex Signals US Session Brief March 12 – Ethereum Is Reversing While EUR/USD Offers Mixed Signals
Cryptocurrencies have been on a slippery slope during last week, but they may have reached a bottom for now. Ethereum is starting to form...

Cryptocurrencies have been on a slippery slope during last week, but they may have reached a bottom for now. Ethereum is starting to form a bullish chart formation and most of major cryptos are following suit. EUR/USD has formed a bullish chart pattern as well, but the price action doesn’t look bullish at all today.

Ethereum is starting to reverse
EUR/USD Looks Uncertain
EUR/USD way feeling bullish last week as it climbed about 300 pips in several days. But the ECB reversed the Euro and sent this pair tumbling down on Thursday. So, it seems like EUR/USD failed to claim 1.25 for the third time and now it has entered a bearish trend.
The price action surely points down. This morning, buyers were trying to push higher and they managed to reach 1.2340. But, the sellers returned and they have undone all the work that the buyers did in just a couple of hours. The price dived below 1.23 again, so it seems like the sellers are in control.
But, the daily chart in EUR/USD offers an interesting picture. It is starting to look like as if it wants to turn higher. As you can see, Friday’s candlestick formed a doji which is a reversing signal after Friday’s bullish candlestick.
Another bullish signal is the 50 SMA (yellow). The price has found support and resistance at this moving average before, with the last occasion being early this year. It held the decline on Friday and it is providing support again today, so it’s going to be a tough nut to crack for sellers. We have a long term sell signal in this pair, so we are bearish here.

We’ll see if the 50 SMA holds this time
Ethereum and Cryptocurrencies Are Reversing Higher
Cryptocurrencies have been sliding lower last week. It was a bearish week through and through, which came after a bullish previous week. It seems like cryptocurrencies are following a pattern. One week they follow a bullish trend, the next the trend reverses and they slide lower until the end of the week.
Last week was all bearish, so this week sh9uld be bullish, right? It surely looks like it that. All cryptos are forming a bullish chart setup on the daily timeframes and today is Monday, which means that the entire week is ahead for the bullish setup to unfold.
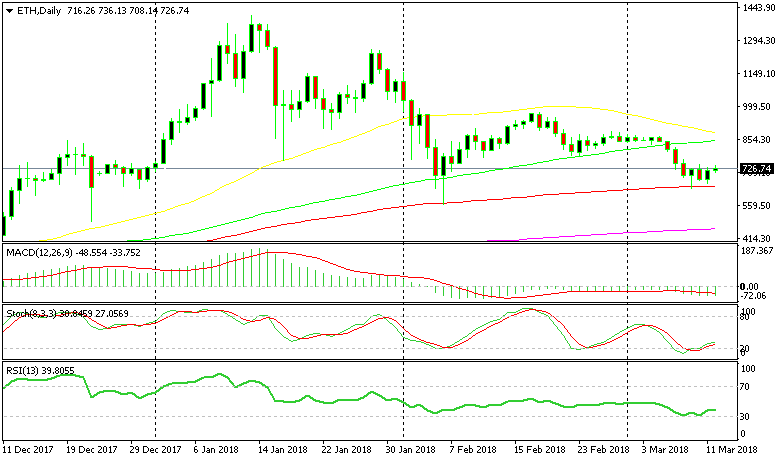
As you can see from the daily chart on Ethereum, this altcoin was declining last week but it reached the 100 SMA (red) on the daily chart. That moving average has provided support earlier this year as well as last year.
It seems like it is doing the same job now. It held the decline on Friday and it provided support yesterday as well. Stochastic is oversold, which means that the move down should be over since the daily chart is oversold. Now stochastic is turning up.
Recent candlesticks look pretty bullish as well. On Friday the price formed a hammer which is a reversing signal, while yesterday it formed a bullish engulfing candlestick. That’s the story in most cryptiocurrencies, so this week should be bullish for them. At least, that’s what the charts are telling us.

The downtrend might have reached a bottom
Trades in Sight
Bullish NZD/USD
- The trend is bullish
- The price is finding support now at the 0.7290 area
- The 100 SMA is providing support on the H4 chart
We went long on this pair already with a short term forex signal. The area around 0.7290-0.73 used to be resistance last week, while now this level is providing support. The 100 SMA is also providing support on the H4 chart. The H1 chart is oversold, so hopefully, we’ll see a reverse higher soon.
In Conclusion
The economic data is very light this afternoon. The price action looks quite as well, so I don’t expect fireworks today. Although, we can still pick one or two trades in this range, so we are scanning the market for more opportunities, hang on. nzd/us
- Check out our free forex signals
- Follow the top economic events on FX Leaders economic calendar
- Trade better, discover more Forex Trading Strategies
- Open a FREE Trading Account


