GBP/JPY Bullish Entry – Ascending Triangle Breakout
Despite the thin trading volume, the Asian session went really well for us. Our trading signals on Gold and the EUR/JPY closed at taking...

Despite the thin trading volume, the Asian session went really well for us. Our trading signals on Gold and the EUR/JPY closed at taking profit, while the GBP/JPY is still floating in profits. Here’s an update on the GBP/JPY trading signal.
GBP/JPY – Ascending Triangle Breakout
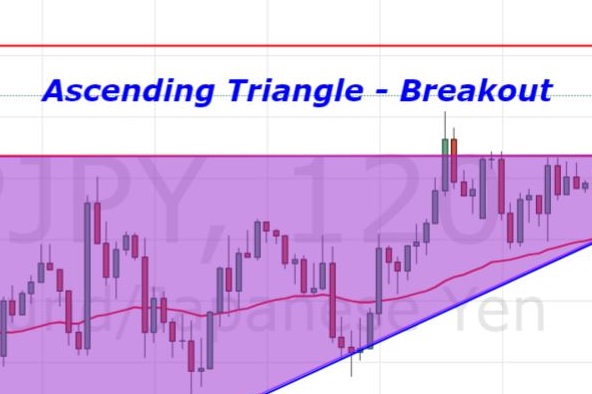
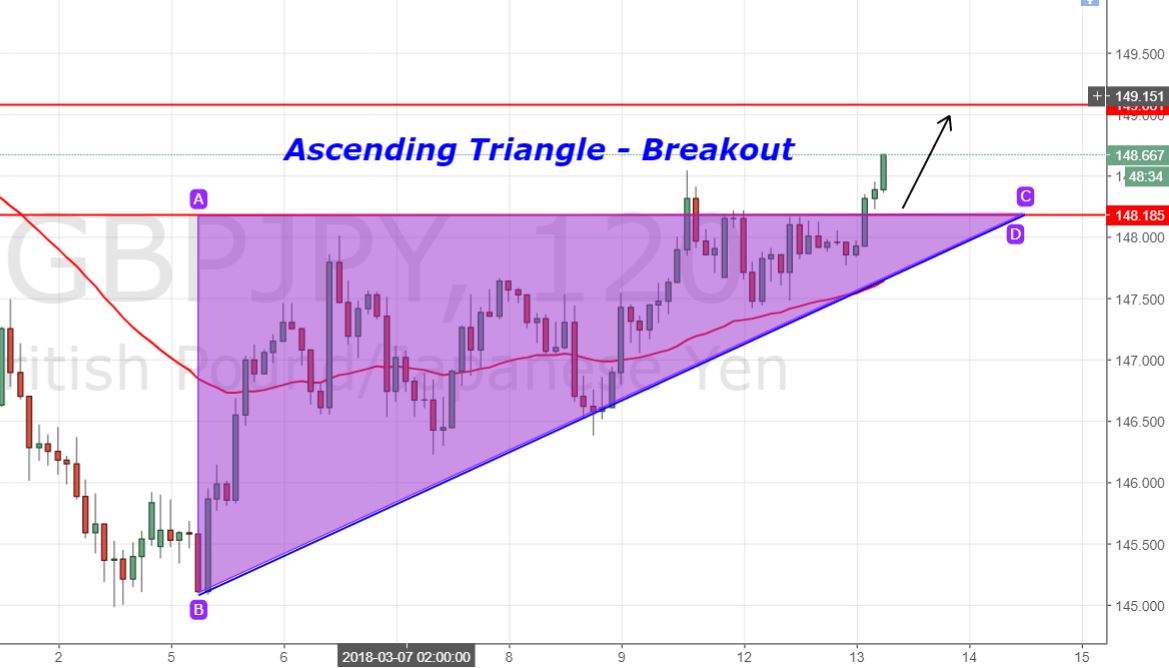
On the 2 hour chart, the GBP/JPY formed an ascending triangle pattern which typically breaks upward. The triangle was extending support at 147.750 along with a resistance at 148.250. The plan was to wait for the pair to come out of the range.
GBP/JPY – 2 Hour Chart
During the early European session, the GBP/JPY finally broke upward to allow us to buy in. For now, the pair is likely to face support above 148.250. The fresh resistance prevails at 149.050 zones. Check FX Leaders Triangles and Wedges – Forex Trading Strategy to understand the patterns.
GBP/JPY – Key Trading Levels
Support Resistance
145.86 148.54
145.04 149.36
143.7 150.7
Key Trading Level: 147.2
GBP/JPY – Trading Plan
Our forex trading plan is to buy above 148.250 with a stop below 148.050 and to take profit at 148.73. Traders are advised to move their stops to breakeven.
Good luck!
- Check out our free forex signals
- Follow the top economic events on FX Leaders economic calendar
- Trade better, discover more Forex Trading Strategies
- Open a FREE Trading Account


