One SMA Gone in NZD/USD, Another Taking Its Place
Yesterday we opened a forex signal with the NZD/USD. This pair was retracing lower in what seemed to be a 3-week uptrend. It reached the 50
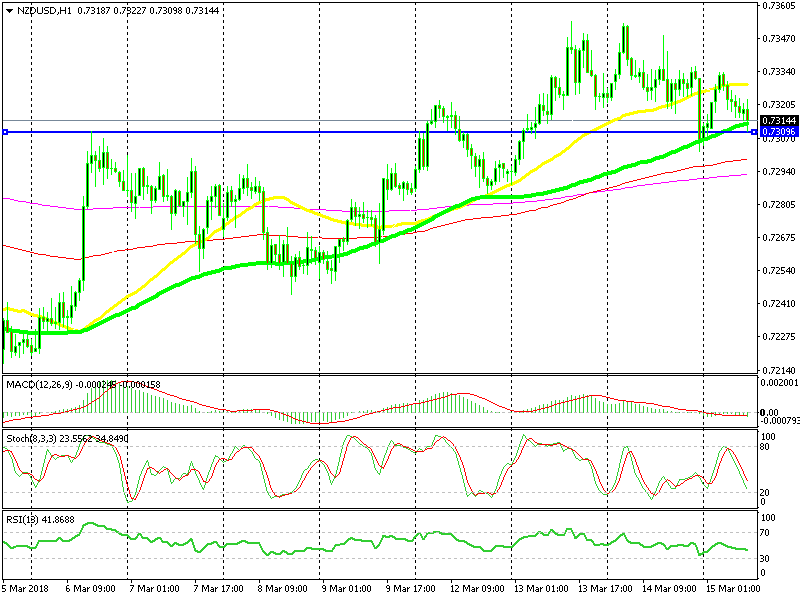
Yesterday we opened a forex signal with the NZD/USD. This pair was retracing lower in what seemed to be a 3-week uptrend. It reached the 50 SMA (yellow) on the H1 chart and was having trouble breaking below it. The price formed a few Dojis so we decided to go long.
The GDP report was scheduled for release in the evening and the market was wary of it. At some point, our forex signal was just a few PIPs below the profit level. The GDP missed the expectations last evening.
Expectations were for a 0.8% reading, while the actual number came at 0.6% previously. The NZD/USD dived about 30 PIPs lower; I thought that was it for our forex signal.

The 100 SMA is providing support again this morning
The 100 SMA came into play, held the decline last evening and is providing support now. The price is a bit higher as this moving average continues to push higher.
The stochastic indicator is oversold on the H4 chart while on this hourly chart, it’s just getting there. The retrace down is almost complete on these timeframe charts. The area around 0.7300-10 is a mild support and resistance area too, so hopefully, we will see a reversal soon.
- Check out our free forex signals
- Follow the top economic events on FX Leaders economic calendar
- Trade better, discover more Forex Trading Strategies
- Open a FREE Trading Account


