GBP/JPY Stuck In a Range – A Quick Technical Outlook
The Japanese cross GBP/JPY completed the retracement at 148.400 but soared again ahead of the most awaited Inflation figures from the UK...

The Japanese cross GBP/JPY completed the retracement at 148.400 but soared again ahead of the most awaited Inflation figures from the UK. The UK CPI numbers will be coming out at 09:30 (GMT) today, along with a number of other indicators including the Retail Price Index, Producer Price Index, Housing Price Index, and the PPI Core Output. But the focus remains on the CPI y/y. Who’s up for the trade idea?
GBP/JPY- Symmetric Triangle In Play
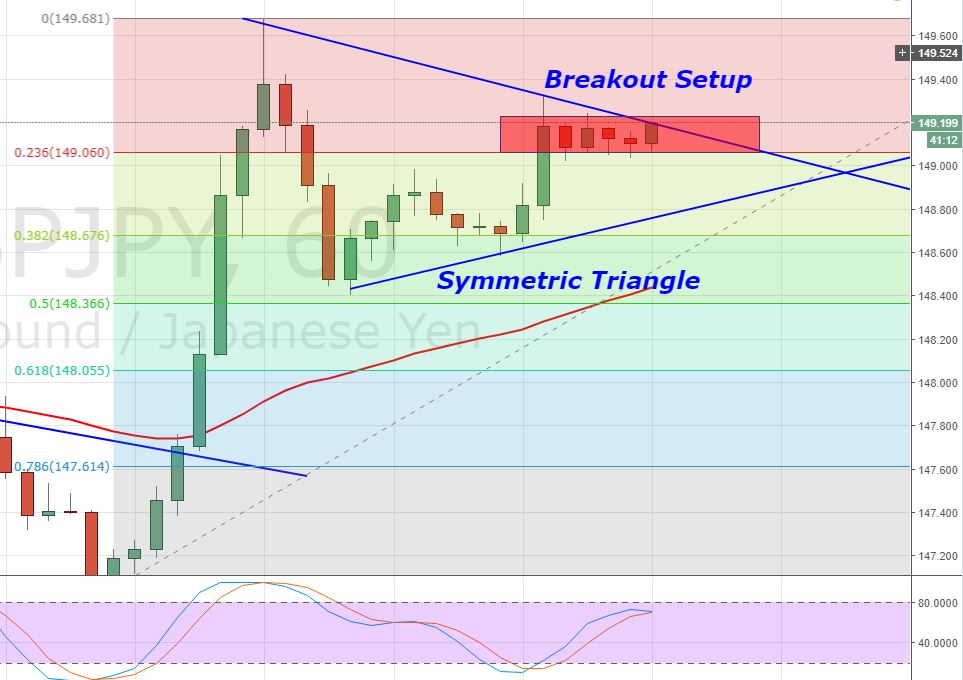
Technically speaking, the cross pair has formed a symmetric triangle pattern with support at 148.850 and resistance at 149.170. Typically, symmetric triangles can break to any side. Check out FX Leaders Triangle Pattern Strategies to learn more about these patterns.
 GBP/JPY – Hourly Chart – Triangle Pattern
This clearly indicates a quiet-before-strong moment as investors are waiting for the CPI figure to take a quick entry. GBP/JPY is facing strong support at 149.000 while having immediate resistance at 149.600.
Both of the leading indicators, RSI and Stochastics, are trading in a buying zone. Moreover, the 50-period EMA is also supporting the bullish bias of investors.
GBP/JPY – Trading Plan
Fellas, it will be better to wait for the economic event before placing any trades. However, on a stronger than expected CPI report, I will be looking to place a buy position above 149.000 for a target between 149.650 and 149.850.
- Check out our free forex signals
- Follow the top economic events on FX Leaders economic calendar
- Trade better, discover more Forex Trading Strategies
- Open a FREE Trading Account
 GBP/JPY – Hourly Chart – Triangle Pattern

