GBP/USD Setup To Trade on UK’s Inflation Rate
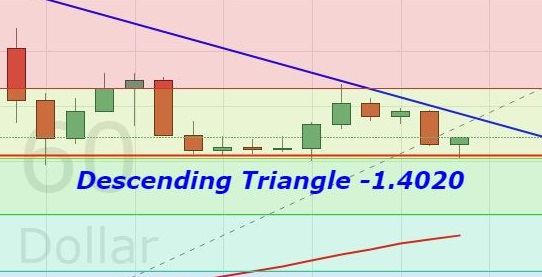
Cable has formed a pretty nice setup before the release of inflation figures today. Looking at the hourly chart, we can see a descending...

The Sterling posted massive gains after news of Brexit settlements between the EU and the UK. After months of squabbling between London and Brussels, both sides finally declared that there would be a transition period following the UK’s departure from the EU in March 2019. In response, the Pound soared dramatically against its peers. But I’m seeing good opportunities to catch today. Check this out…
GBP/USD- Potential Descending Triangle
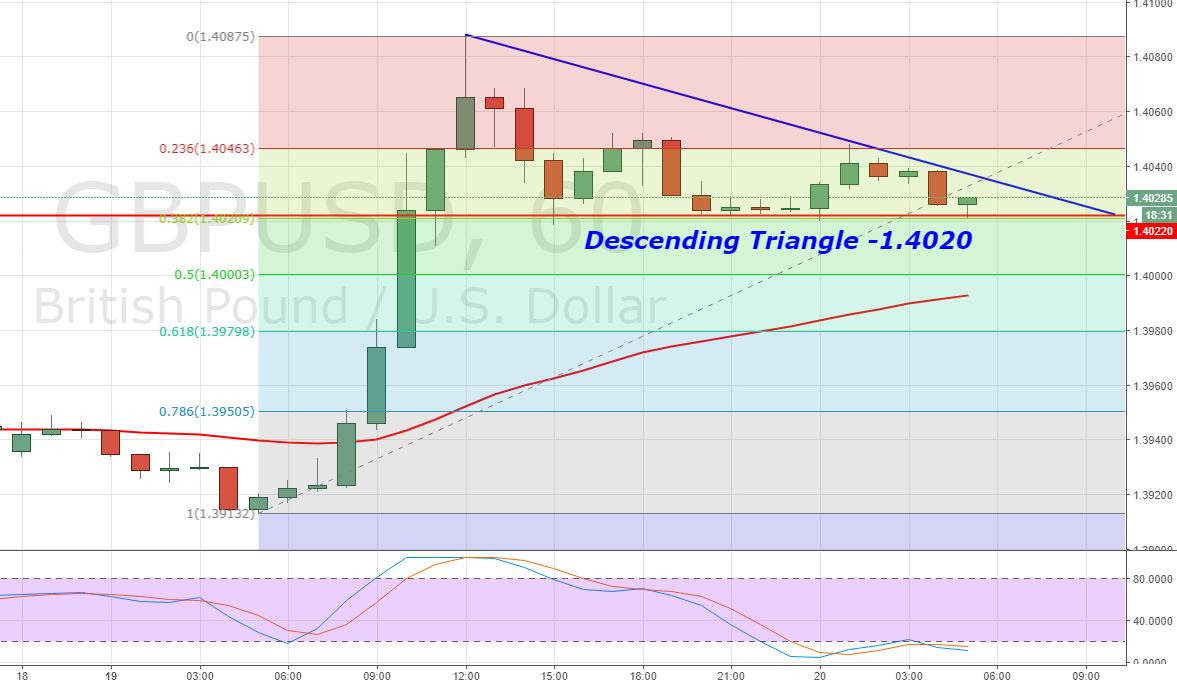
Traders, the Cable has formed a pretty nice setup before the release of inflation figures today. Looking at the hourly chart, we can see a descending triangle pattern which is supporting the pair at $1.4020. However, resistance prevails at $1.4040.
 GBP/USD – Hourly Chart
A break below $1.4020/1.4000 can lead the pair towards 1.3975 and that’s where GBP/USD completes a 61.8% Fibonacci retracement.
GBP/USD – Key Trading Levels
Support Resistance
1.3943 1.4075
1.3901 1.4117
1.3835 1.4183
Key Trading Level: 1.4009
GBP/USD – Trading Plan
Investors are advised to keep a close eye on $1.400 & 1.3985. Above these areas, the market is likely to continue its buying trend. I will be looking to take a bullish position above these areas.
- Check out our free forex signals
- Follow the top economic events on FX Leaders economic calendar
- Trade better, discover more Forex Trading Strategies
- Open a FREE Trading Account
 GBP/USD – Hourly Chart

