Butterfly Pattern Spotted In EUR/JPY – A Swing Trade Plan!
While doing my analysis, I spotted a butterfly pattern in EUR/JPY which offers us a good long-term entry. Take a look at the 4-hour chart...
Asian investors seemed to be a bit shy ahead of FOMC and the Fed rate announcement. The market behavior is quite obvious, but we can trade the cross pairs which are rarely influenced by the US dollar. Buckle up for a swing trade in EUR/JPY…
Trading The Butterfly Pattern
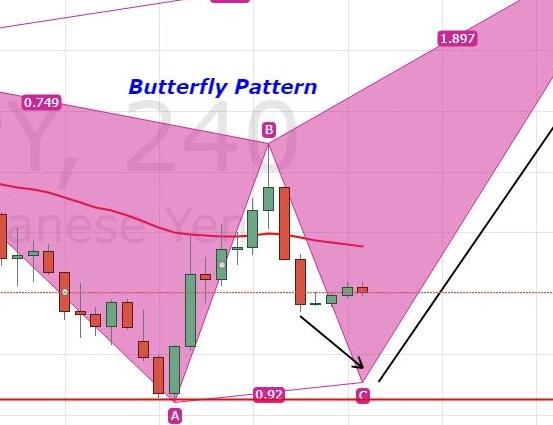
While doing my analysis, I spotted a butterfly pattern in EUR/JPY which offers us a good long-term entry. Take a look at the 4-hour chart below. The EUR/JPY has completed the A to B wave at 131.650. However, the candles failed to close above the 61.8% Fibonacci retracement level.

EUR/JPY – 4 – Hour Chart
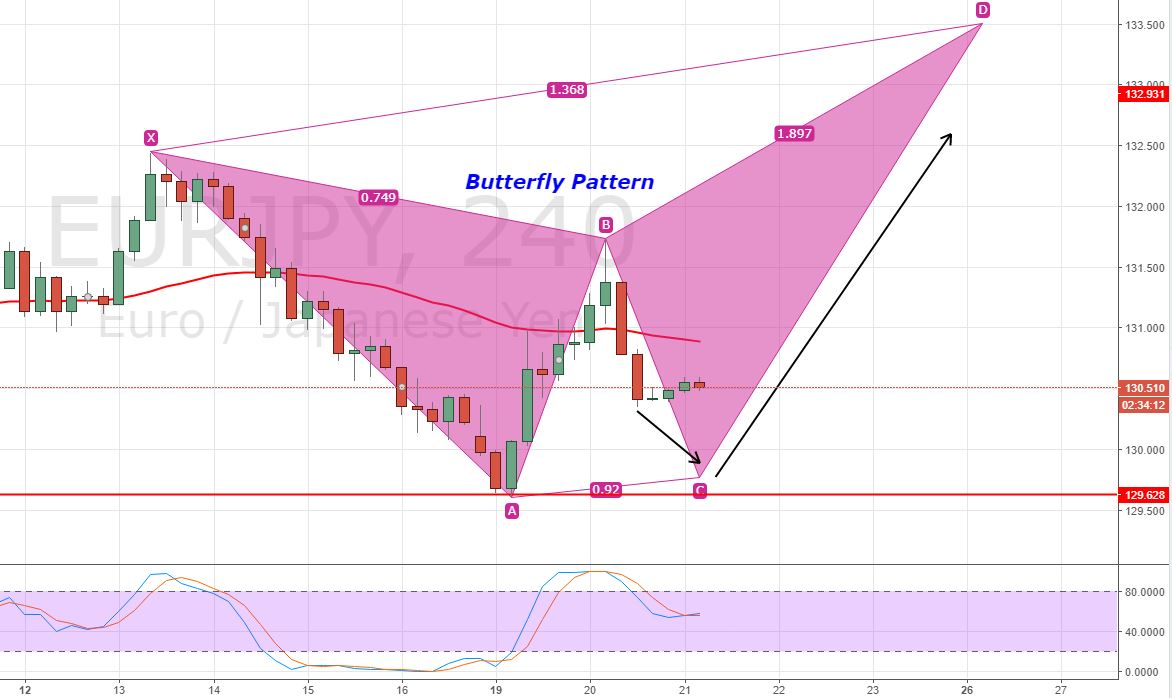
For now, the pair seems to be going after the C level which is somewhere around 129.750. Once the B to C wave is completed, I will be looking to take a buy entry above 129.750 with a stop below 129.350 and targets of 131.70 and 133.050.
Support Resistance
130.29 131.35
129.95 131.69
129.42 132.22
Key Trading Level: 130.82
- Check out our free forex signals
- Follow the top economic events on FX Leaders economic calendar
- Trade better, discover more Forex Trading Strategies
- Open a FREE Trading Account