Forex Signals US Session Brief March 26 – The Downtrend Continues for the USD and Cryptocurrencies
The USD doesn’t seem to be able to catch a break. It looks like the market wants to push it up but negative fundamental events keep popping

The USD doesn’t seem to be able to catch a break. It looks like the market wants to push it up but negative fundamental events keep popping up and the USD keeps taking hits. The situation is similar for cryptocurrencies. They have formed bullish chart setups recently, but eventually they end up trending downwards.

At least we know what the market wants: safe havens
The USD Tumble Continues
The US Dollar has been trying to reverse the downtrend of the last year. In the last two months, buyers have gained confidence while sellers have lost some confidence. Last year, sellers would jump in after every small retrace and take the Buck a few cents lower. Now, buyers are not exactly in control but neither are sellers. Sellers have not been able to push price to new lows.
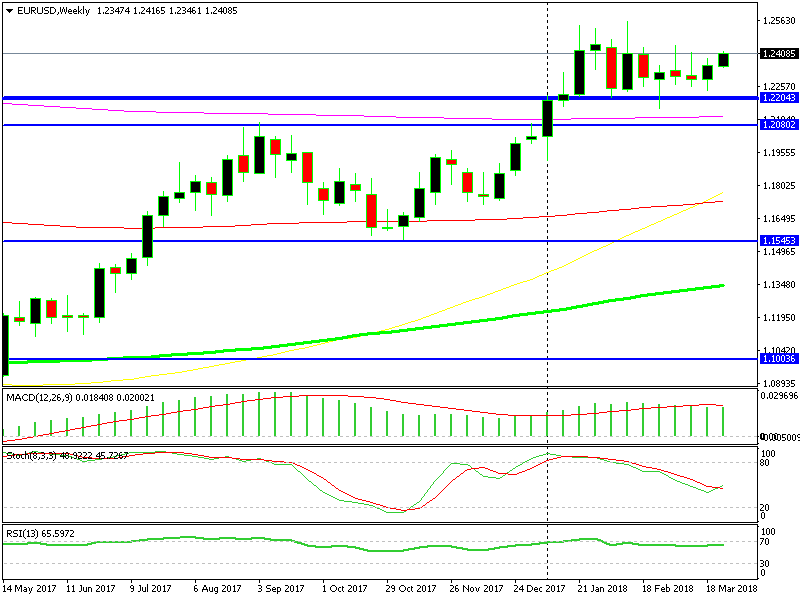
The situation is upside down in EUR/USD. This forex pair has made quite a climb from January last year until January this year. But in the last two months, buyers haven’t been able to make new highs. In the past two weeks, EUR/USD has formed two upside down pin candlesticks.
The upside down pins point down, but price did not respect the technical setup last week. Last week’s candlestick was supposed to be bearish, but eventually, it turned into a bullish candlestick. Fundamentals seem to be more important than technicals now, so they are ruining every chart setup in major pairs.
The picture is very blurry for the USD and as a result, it is blurry for most forex majors. The commodity Dollars pushed higher against the Buck as well, although we saw that as an opportunity to open a sell forex signal, which we will explain below.

EUR/USD still looks very uncertain on the weekly chart
Litecoin back at the 100 SMA as Cryptocurrencies Continue the Downtrend after the Weekend
Just like EUR/USD, Cryptocurrencies have been sliding down in the last few months after the epic uptrend last year. Sometimes, it looks like they want to reverse back up, but the attempts to make the reverse and resume the uptrend have ended up being nothing more than just attempts.
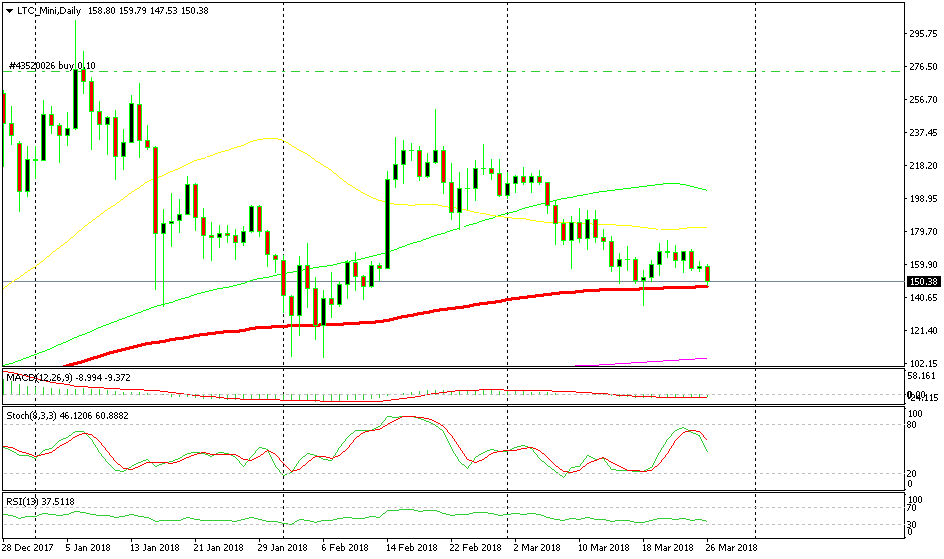
Last Sunday, Litecoin reached the 100 SMA (red) on the daily chart. It formed a big doji at that moving average as you can see and started reversing up. The doji is a strong reversal signal especially when a financial instrument is oversold or overbought and the stochastic indicator was severely oversold back then.
The reverse started taking form in the next few days, but once stochastic got close to the overbought area, the downtrend resumed. Price formed another doji at the top and the reverse down continued.
The stochastic is now heading down whilst Litecoin is back at the 100 SMA. This moving average has been the line in the sand for Litecoin; it has provided support and kept the larger uptrend going for about two years. Although, it seems like this time it might be broken. The downside has picked up pace today and stochastic is half way down; so there’s plenty of room until it becomes oversold.
Will it be broken today? We will see as the day progresses. If it gets broken, that will be a big bearish sign which will ring the alarm for buyers.

The 100 SMA is the deciding level for Litecoin
Trades in Sight
Short AUD/USD
- The major trend is bearish
- The stochastic is almost overbought
- The 50 SMA (yellow) is providing resistance

We already booked profit on this trade
We opened a sell forex signal on AUD/USD a while ago and already closed it in profit. The trend is still down despite the climb last Friday. The stochastic indicator was almost overbought and the 50 SMA was providing resistance on top, so we decided to go short. It was an easy decision and we got our pips from that trade.
In Conclusion
The US Dollar has continued the downtrend that started last week, but buyers are returning. So, forex majors are not that straightforward today. We have several live forex signals which we will try to nurse during the US session.
- Check out our free forex signals
- Follow the top economic events on FX Leaders economic calendar
- Trade better, discover more Forex Trading Strategies
- Open a FREE Trading Account


