EUR/USD Forming A Bullish Reversal Pattern Above the 100 SMA
EUR/USD completed the next leg of the uptrend yesterday as it climbed more than 100 pips from the lows at market open on Sunday. When the Eu
EUR/USD completed the next leg of the uptrend yesterday as it climbed more than 100 pips from the lows at market open on Sunday. When the European session opened today, buyers tried to push higher but the USD received an energy boost which caused the EUR/USD to reverse back down.
The reverse came after this forex pair formed a doji on the H1 chart. Dojis are reversing signals and that bearish reversal chart setup worked pretty well.
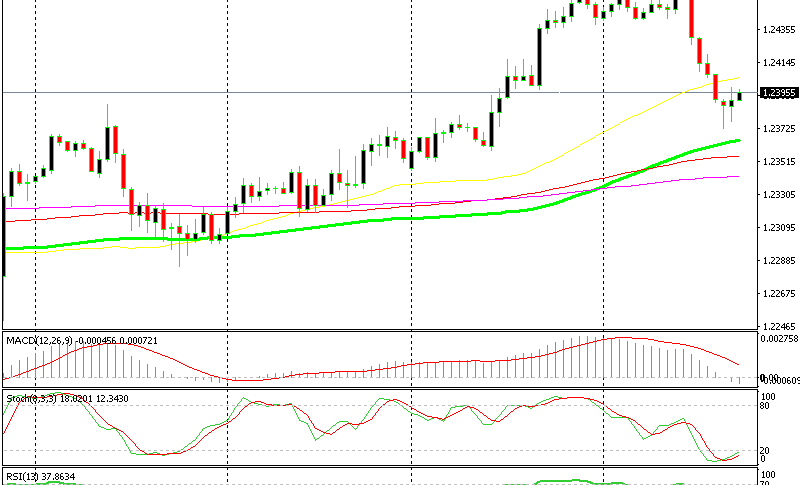
The H1 Chart Setup
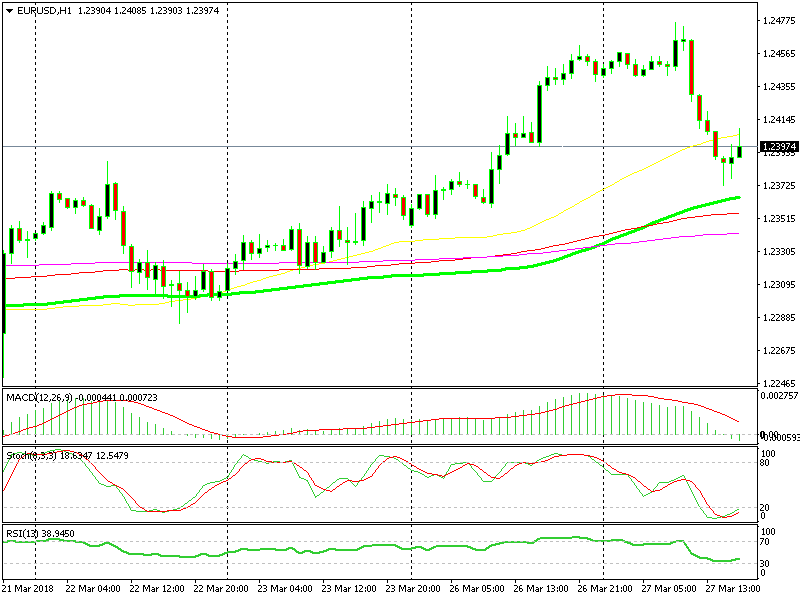
The retrace lower seems complete now
Now we are seeing the same chart formation this time at the opposite end. Now, EUR/USD has formed a hammer and a doji; both of which are reversing signals. The stochastic indicator is oversold so the retrace is complete and the uptrend should resume soon.
This bullish reversal chart pattern is taking place just above the 100 SMA (green). This moving average has provided support and resistance before as you can see from the chart above. You can be sure that EUR/USD traders are taking note.
The H4 Chart Setup
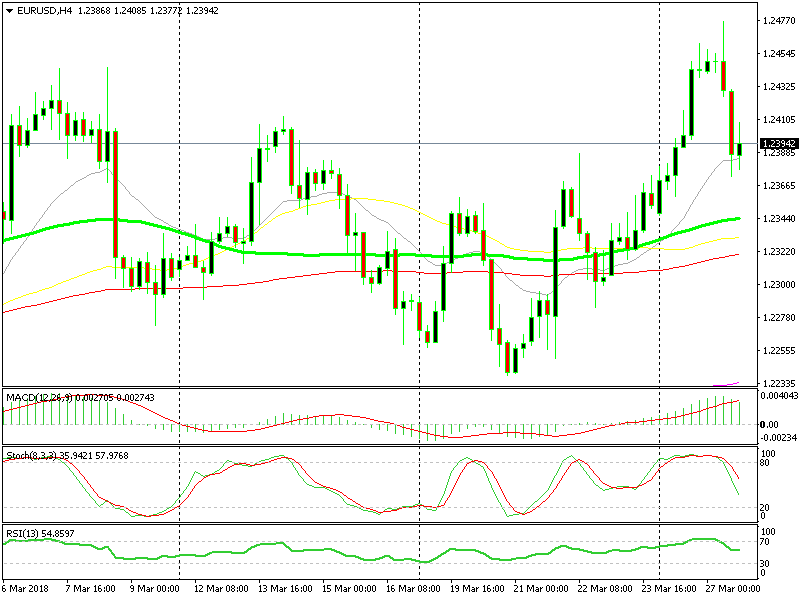
The 20 SMA is providing strong support
Switching to the H4 chart, you can see that it is not oversold yet since stochastic is still heading down with room to spare. But, the 20 SMA is doing a good job of providing support. It has been pierced twice as the lower candlestick shadows suggest. But it has closed above it and price is still above the 20 SMA. So, it seems like this pair is turning higher and resuming the uptrend. Who wants to go long?
- Check out our free forex signals
- Follow the top economic events on FX Leaders economic calendar
- Trade better, discover more Forex Trading Strategies
- Open a FREE Trading Account


