Decisive Moment for Bitcoin, and Other Cryptocurrencies
As we have often mentioned recently, Bitcoin has been trending down in the last three months. After the big surge at the end of last year...

The Weekly Setup
As we have often mentioned recently, cryptocurrencies have been trending down in the last three months. After the big surge at the end of last year, the trend shifted to bearish and it has been going on since then.
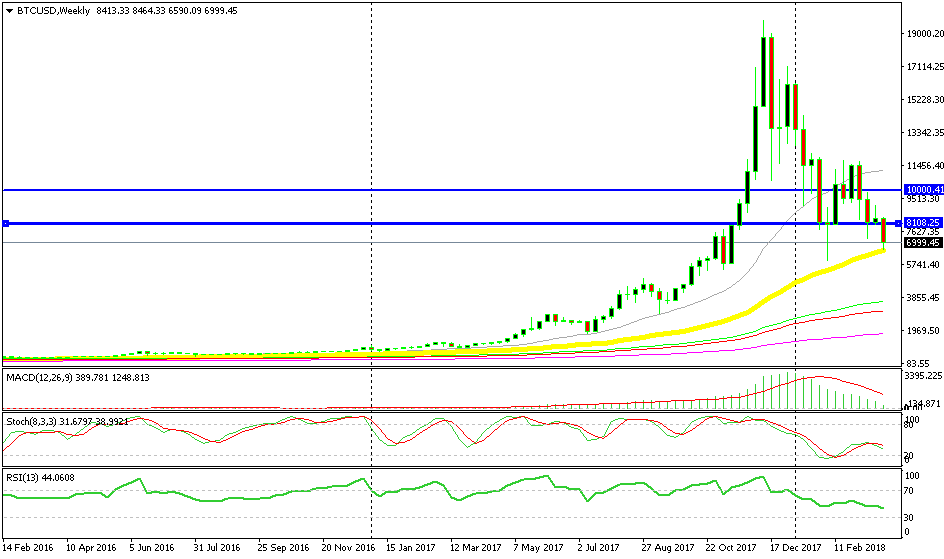
Although, Bitcoin has reached a level now where another reverse might take place, this time to the upside. As you can see from the weekly chart below, the bigger trend is still up, so the reverse we have been seeing in the last three months is a retrace of the bigger trend. That’s if the price reverses back up now, because if the sellers remain in control and push Bitcoin lower, then we can say that the bigger trend is changing.

The 20 SMA is a big support indicator
But, the 50 SMA yellow is standing in the way. Bitcoin touched that moving average today and backed off, moving slightly higher. If this moving average holds and the price starts reversing, then that would be a sign that the retrace down is over.
The Daily Setup
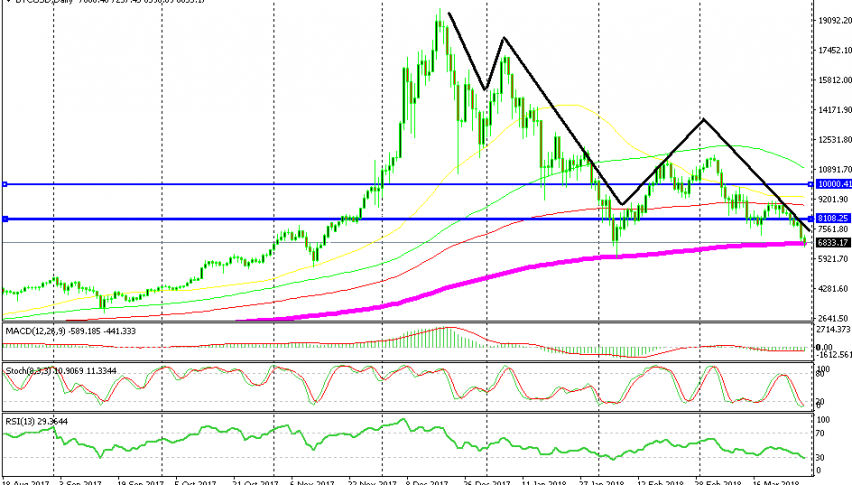
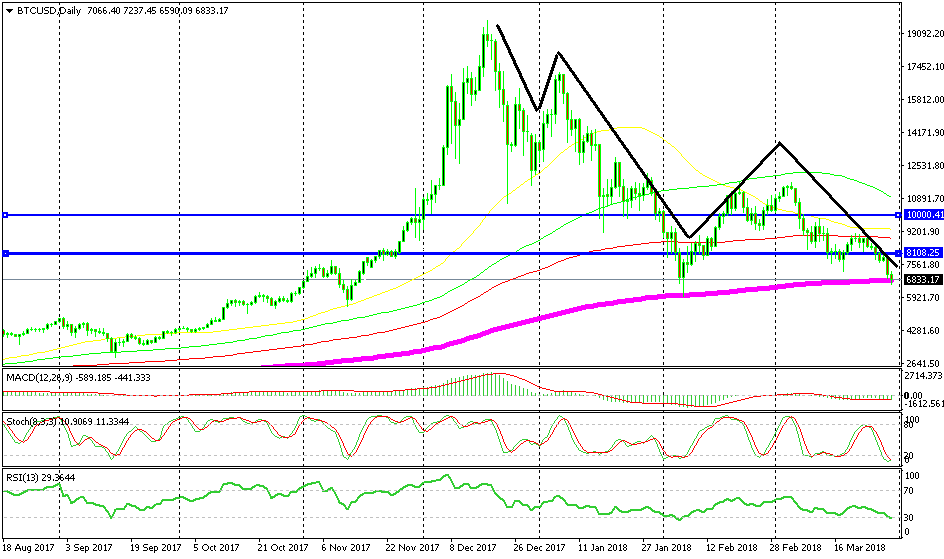
On the daily Bitcoin chart, we can see that the 200 SMA (purple) is standing at the same place as the 50 SMA on the weekly timeframe. That moving average is providing support and the stochastic indicator has become oversold, so the retrace seems complete on this chart too.

The 200 SMA is doing the job here
Besides that, the Elliot Wave Pattern seems complete too. This pattern unfolds in five waves, three down and two correctional waves up. The five waves are complete and the 200 SMA which has reversed Bitcoin higher previously is providing support again. So, it seems as the big retrace will be over soon. But again, that’s if the sellers don’t push further below which would ruin both chart setups.
- Check out our free forex signals
- Follow the top economic events on FX Leaders economic calendar
- Trade better, discover more Forex Trading Strategies
- Open a FREE Trading Account


