The Bullish Chart Reversal Takes Form in USD/JPY
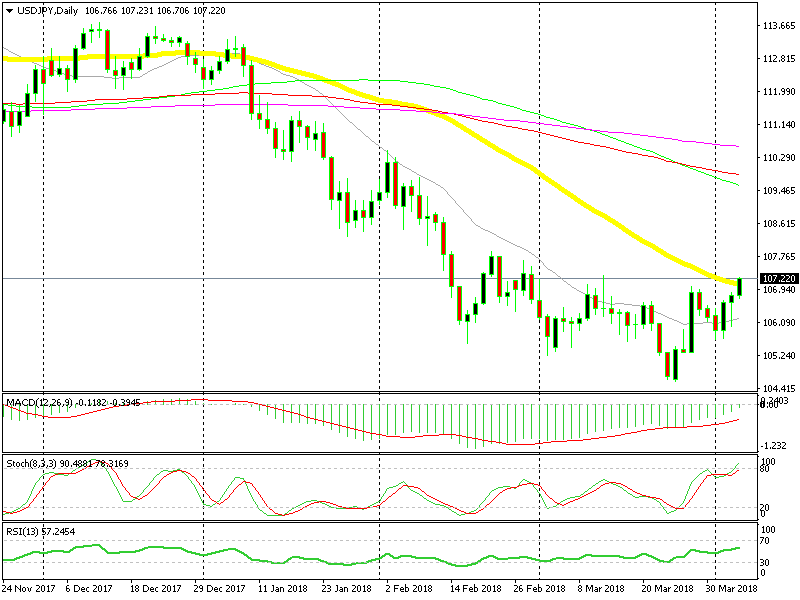
USD/JPY has been trading on a bearish trend for the last three months. The downtrend picked up pace after breaking below the 1.10 level.
USD/JPY has been trading on a bearish trend for the last three months. The downtrend picked up pace after breaking below the 1.10 level. Eventually, it broke below 108 and 105, both of which are/were major support levels.
But, it started reversing suddenly last week at 104.50s. That is not a support level but it’s close to the big support level at 105. What I can make of this sudden reverse, is that the big money targeted 105, but it pushed below 105 in order to trigger some weak stops. Now that the stops have been triggered, USD/JPY starts reversing up.
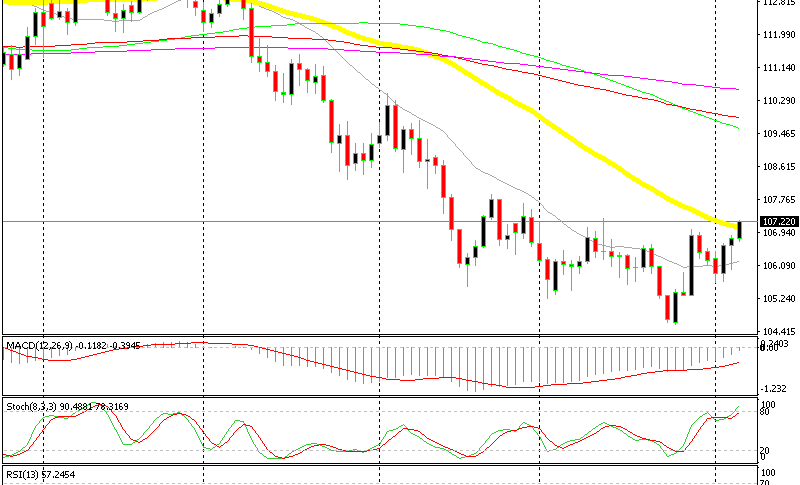
The 20 SMA (grey) has been holding this pair down in the last two months, so it was a big bullish sign when the buyers managed to push above it by late March. Although, the 50 SMA remained and it cast a shadow on the buyers.
The 20 and the 50 SMAs have both been broken now
This pair retraced down in the last few days of March, but the buyers got their act together and reversed the price back up. Today, they pushed USD/JPY above the 50 SMA, as you can see.
This is another bullish sign. The buyers look in control as they brake moving averages one after another. So, the situation is reversing for this pair and it looks increasingly bullish now. Perhaps we might open a long term buy forex signal here, but I will wait for a retrace lower first, you know how I like to trade pullbacks.
- Check out our free forex signals
- Follow the top economic events on FX Leaders economic calendar
- Trade better, discover more Forex Trading Strategies
- Open a FREE Trading Account