USD/CAD Breakout Triangle – Trade Balance Figures In Focus!


What’s up, traders?
The USD/CAD continues to trade bearish as the trade war fear is denting the demand for the US dollar. Today, the market is all about Loonie, and the trade balance figures from Canada is the only important data before US Non-farm payroll tomorrow. Check out the trade plan…
USD/CAD – Descending Triangle Breakout
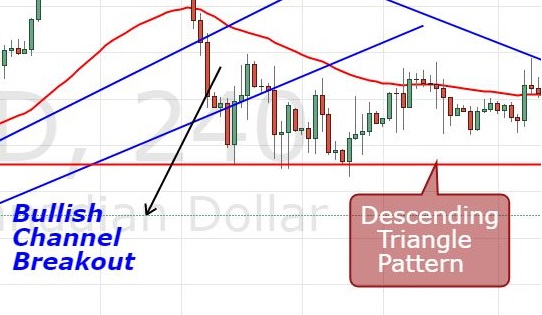
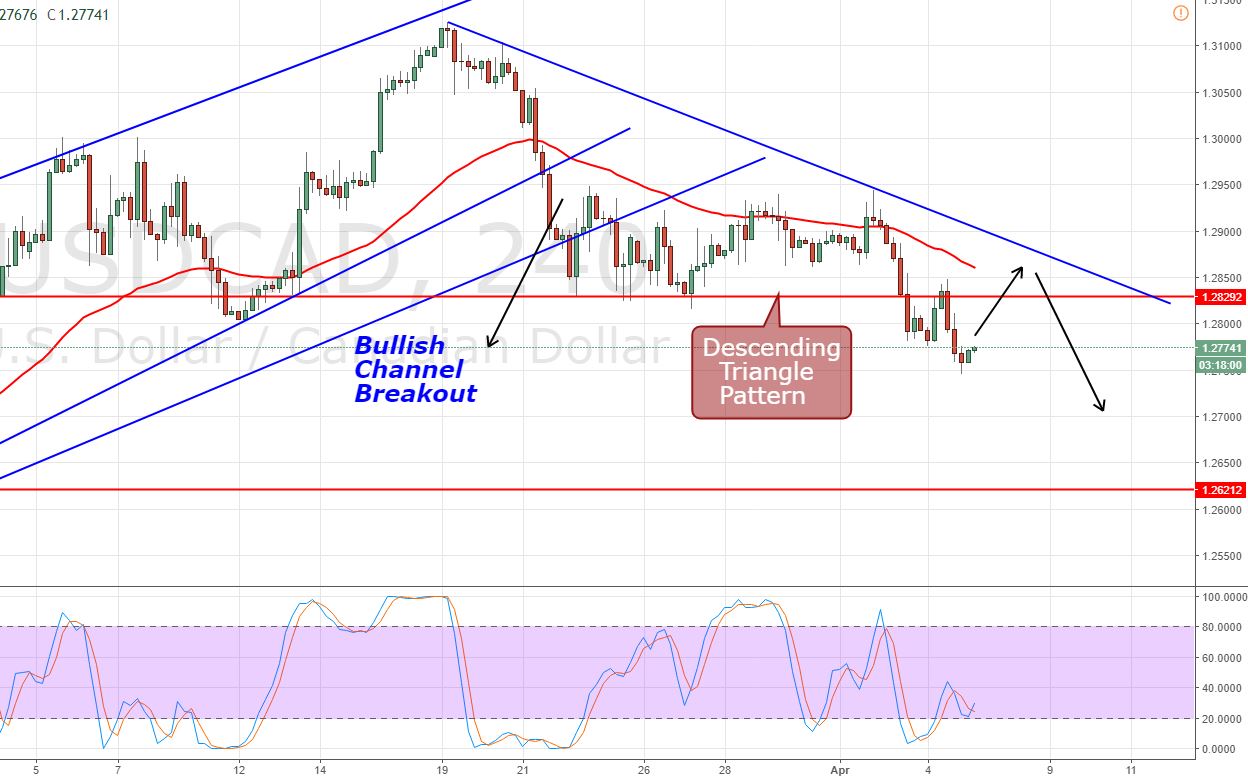
Loonie took a really nice u-turn, breaking the bullish channel on a lower side. The bullish channel supported the pair near 1.2900. Later, the USD/CAD consolidated in the descending triangle pattern which supported the pair at 1.2829.
 USD/CAD – 4 Hour Chart
 USD/CAD – 4 Hour Chart
A day before, the USD/CAD managed to break below $1.2830 and now the same level is working as a potential resistance. The pair has the potential to continue selling until $1.2740 and $1.2625. You can see on the 4-hour chart, the RSI and Stochastics are trading below 50, signaling the bearish sentiment of investors.
USD/CAD – Key Trading Levels
Support Resistance
1.2722 1.2818
1.2689 1.2881
1.2626 1.2914
Key Trading Level: 1.2785
USD/USD Trading Plan
Fellas, I’m looking to do choppy trading before the release of the trade balance figures. The idea is to take a buying position above $1.2750 with a target of $1.2810. On the selling side, staying bearish below 1.2810 looks like a good plan. Good luck!