We Finally Took the Trade Based on the 50 SMA
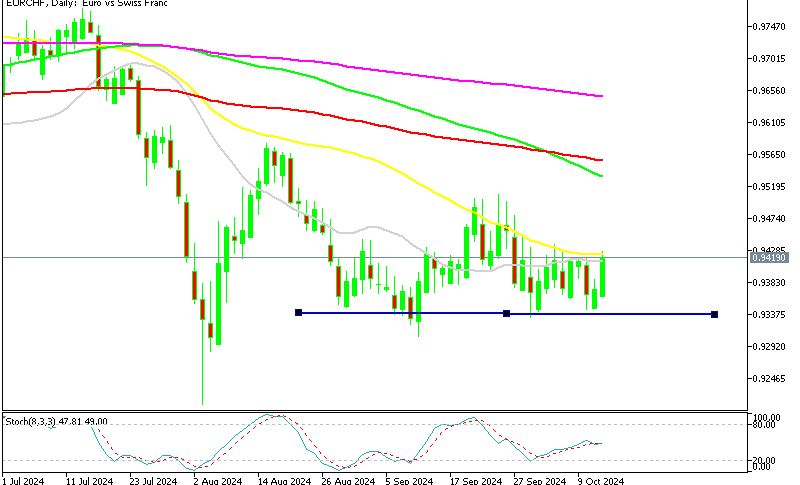
Earlier today we spoke about EUR/CHF. This forex pair has looked increasingly tempting for buyers but we wanted to get a better price lower.
Earlier today we spoke about EUR/CHF. This forex pair has looked increasingly tempting for buyers but we wanted to get a better price lower, so we refrained and waited a bit longer.
The H4 Chart
The US employment report was the trigger which finally gave this pair the last push lower. I was waiting for the price to reach the 50 SMA (yellow) on the H4 chart since this moving average has been providing support for a few weeks. It got broken two weeks ago, but the price moved back above it again, so it has been the defining level for EUR/CHF bulls.
The US employment came out sort of mixed and it mixed the market. The Euro moved higher but EUR/CHF moved lower. At first, safe havens didn’t move but they started receiving bids after the report was released.
The 50 SMA is doing its job again
As a result, EUR/CHF started tumbling lower and it finally reached the 50 SMA. The funny thing is that we couldn’t catch the price down there. So we entered about 10 pips higher form the low. It has started to reverse now since the H4 candlestick has retraced most of the losses.
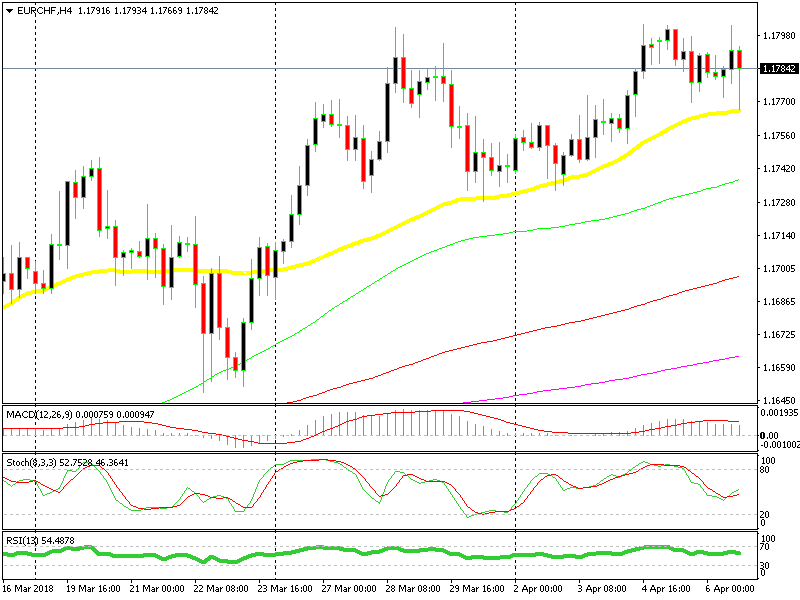
The H1 Chart

The 100 SMA adds more strength to the 1.1760-70 area
If you switch to the H1 chart, you can see that the 100 SMA provided support, which means that it stands at the same level as the 50 SMA on the H4 chart. This strengthens the support area and it looks like the reverse is taking place. Although, the 50 SMA (yellow) on the H1 chart looms above. The buyers must push past this moving average so we can get our pips, fingers crossed.
- Check out our free forex signals
- Follow the top economic events on FX Leaders economic calendar
- Trade better, discover more Forex Trading Strategies
- Open a FREE Trading Account