U.S. Indices Rally, Key Technical Level For The S&P 500
U.S. equities are up on the day, led by a 1.25% gain in the DJIA. The S&P 500 is also being dominated by bullish sentiment, up 1.15%. Investors are piling into equities in anticipation of the first-quarter earnings reports. Most of the players on Wall Street are expecting strong Q1 numbers across many sectors.
Today’s action certainly reflects a positive view toward the U.S. indices. Amid concerns out of Russia, a pause in trade war rhetoric, and Q1 earnings, Monday’s news cycle has treated U.S. equity bulls very well.
S&P 500 Technical Outlook
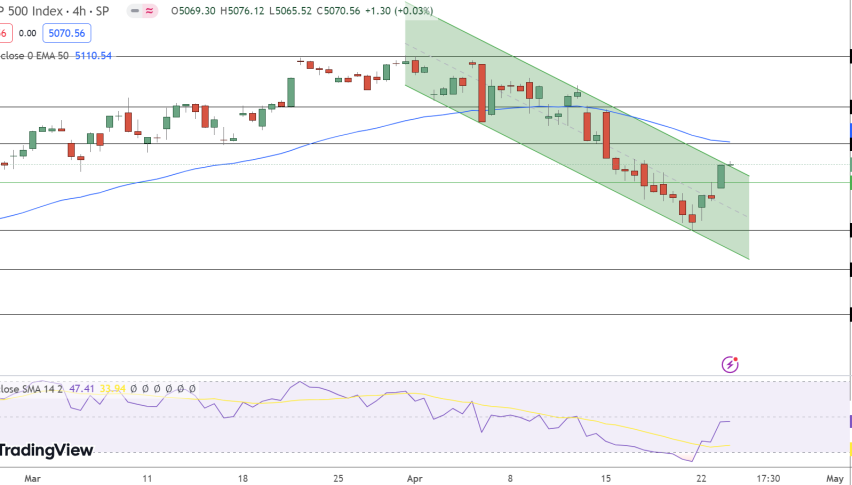
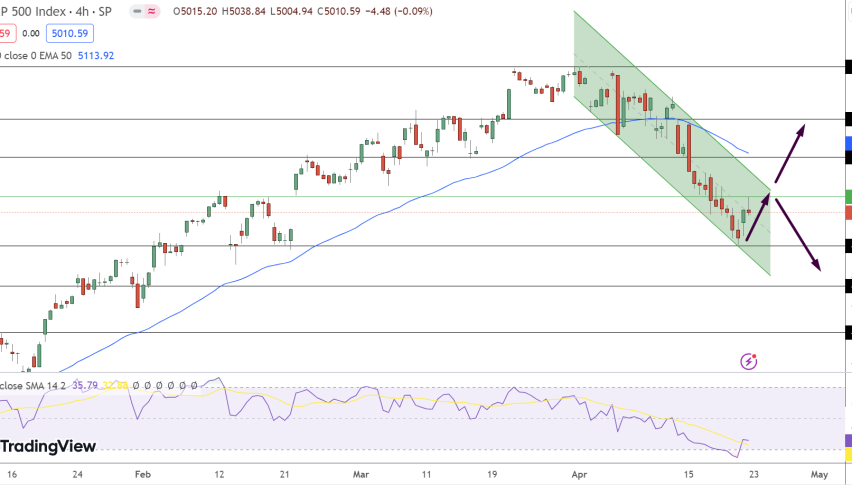
June E-mini S&P 500 futures are firmly in the green, gaining back much of Friday’s loss. Price is approaching a key technical level on the daily timeframe.
++4_9_2018.jpg)
Here are the topside resistance levels to keep an eye on for the rest of the day:
- Resistance(1): 38% Retracement of Current Wave, 2649.50
- Resistance(2): Bollinger MP, 2666.50
Bottom Line: The 38% Fibonacci retracement at 2649.50 is the primary technical level in this market. If it holds as resistance, the intermediate-term bearish trend that started in early March will remain valid.
I expect the June E-mini S&P 500 to enter a rotational phase between 2650.00 and 2552.00. This is a fairly wide range, but it has been traded with heavy volume over the last 10 sessions.
The current intraday bullish pressure is highly likely to drive price to the 2650.00 handle. If we receive proof of exhaustion near the 2650.00 area, a position short may come into play for later in the week.


