USD/JPY Confirming the Uptrend
Last week we posted a few updates about USD/JPY where we highlighted the trend reversal in this pair. USD/JPY has been on a downtrend...
Last week we posted a few updates about USD/JPY where we highlighted the trend reversal in this pair. USD/JPY has been on a downtrend in the last three months, but during the last two weeks, it looked like the trend was reversing.
Today, this opinion has become stronger after looking at the H4 and daily forex charts. If you take a look at the H4 chart, you can see that the price moved above the 100 smooth moving average (red) last week.
Moving averages have been pushing this pair lower during the downtrend. The price hasn’t been able to move above this moving average since the beginning of the downtrend in early January. Now, USD/JPY has moved above this moving average, which has turned into support.
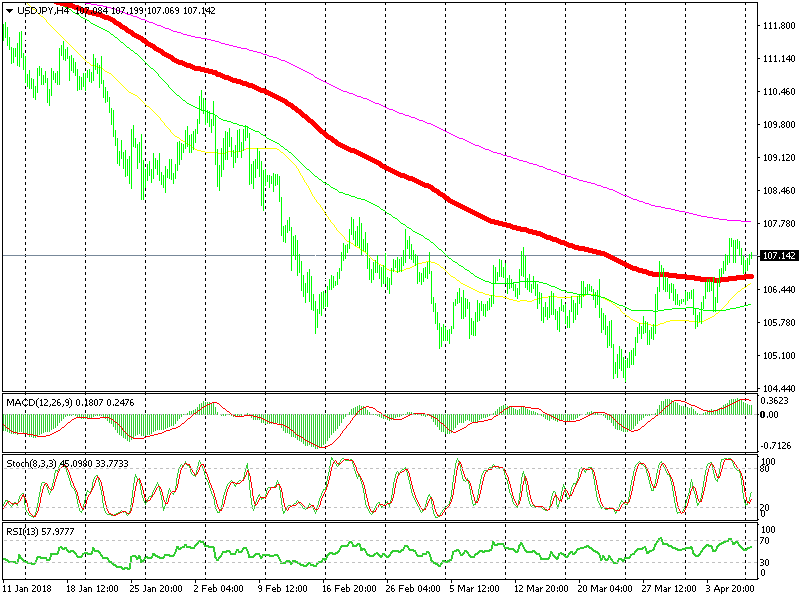
The 100 SMA held the decline
USD/JPY retraced lower last Friday, but the 100 SMA held the ground. You can see that the price formed a doji candlestick early in the morning if you zoom in. That’s a reversing signal and the price reversed back up after stochastic reached oversold levels.
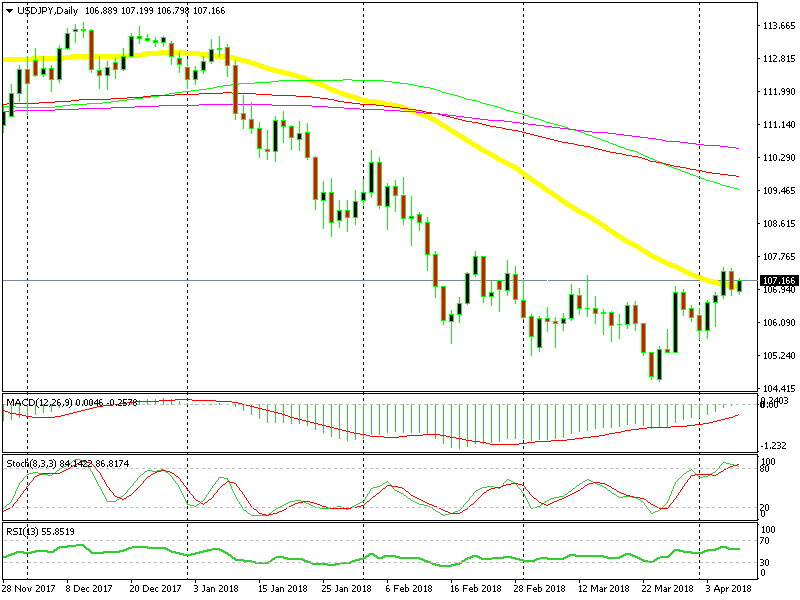
The 50 SMA has turned into support now
Switching o the daily chart, we can see another sign that the trend has shifted from bearish to bullish. As I highlighted last week, the price moved above 50 SMA (yellow). I said last week that if the trend has changed, then this moving average should turn into support now that it has been broken to the upside. Well, it did provide support today after the retrace lower on Friday. So, we can say for sure that the trend in USD/JPY has changed to bullish now.
- Check out our free forex signals
- Follow the top economic events on FX Leaders economic calendar
- Trade better, discover more Forex Trading Strategies
- Open a FREE Trading Account