EUR/USD Remains Bullish Today but faces the 50 SMA
EUR/USD has been trading on a bearish trend in the last two weeks. It failed to break and stay above the 1.25 level so it reversed down
EUR/USD has been trading on a bearish trend in the last two weeks. It failed to break and stay above the 1.25 level so it eventually reversed two weeks ago and it lost around 250 pips during that time.
EUR/USD reached 1.2215 on Friday last week. The area around 1.22 has been support for the last three months which means that it is a tough level to break for sellers. The sellers gave up once again at this support level and this pair has been trading up in the last two trading days.
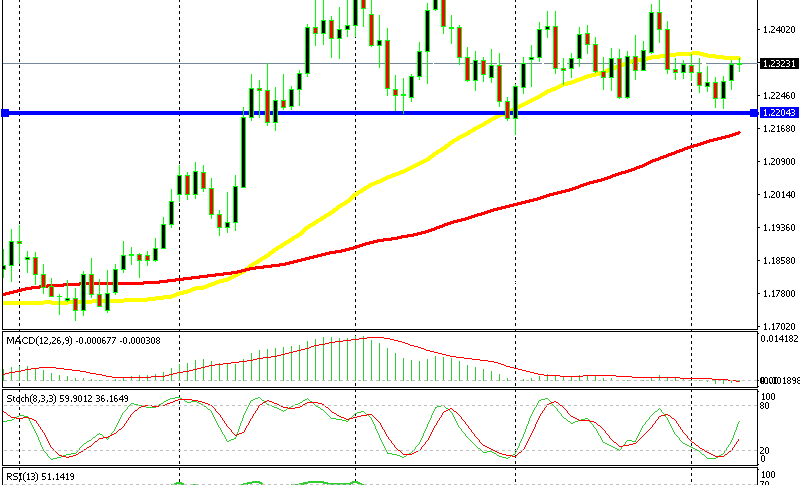
On the daily chart, we can see that the 100 SMA red has caught up with the price at 1.22. So, that moving average added more strength to the support area. In this chart that moving average comes a bit lower, but I will post another chart of my second broker, where the 100 SMA has already caught up with the price. Different brokers different charts, isn’t it? They’re making life just a bit more difficult.
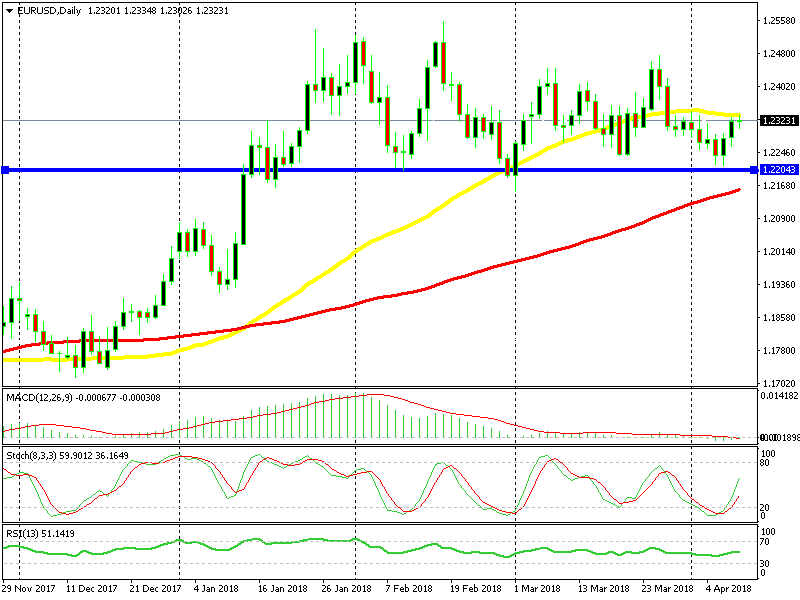
EUR/USD is trading between 1.22 and the 50 SMA now
Anyway, in the last two days, EUR/USD has gained a bit more than 100 pips, but now faces another moving average, this time on the top side. As you can see from the daily chart above, the price is trading just below the 50 SMA. It hasn’t been a major support and resistance indicator recently, but it might turn today into resistance.
The stochastic indicator will be overbought soon, probably tomorrow. This means that the move up will be over and a revere might follow. We don’t know that for sure, but if it happens, it will be a bearish sign since the tops will be getting lower.
- Check out our free forex signals
- Follow the top economic events on FX Leaders economic calendar
- Trade better, discover more Forex Trading Strategies
- Open a FREE Trading Account


